Data Analyst Salary in Taylor, MI: $57,742 (2026)
Quick Answer:A full-time data analyst in Taylor, MI earns a median $57,742/year (≈ $27.76/hour) in nominal terms for 2026 — projected from BLS OEWS 2025 (SOC 15-2051). Once you factor in Taylor's price level (7% below national, BEA RPP 93.2), that paycheck buys what $61,955 would nationally. Nominal pay sits 0.9% below the Michigan state average.
Based on BLS state-level estimates · View source
With a projected median annual salary of $57,742 in 2026, data analyst roles in Taylor, Michigan, present a compelling opportunity, though they fall short of the national median of $80,394, reflecting a significant 28.18% disparity. Salaries here range widely from a low of $33,490 at the tenth percentile to a high of $89,500 at the ninetieth percentile, illustrating the variance across different levels of experience and specialization. These figures, derived from 2025 BLS data, consider regional price parities, which help to contextualize the local job market's competitive stance, particularly when factoring in growth projections that indicate a 4.48% annual increase. As Taylor continues to evolve its job market, the potential for growth in the data analytics sector remains promising, especially for those with the right skill sets.
About the Taylor Market
Salary estimated from Michigan average ($105,000) adjusted for local cost of living.
Salary Breakdown
| Percentile | Annual | Hourly |
|---|---|---|
| Entry Level (P10) | $33,490 | $16.10 |
| Lower Range (P25) | $42,650 | $20.51 |
| Median (P50)(typical) | $57,742 | $27.76 |
| Upper Range (P75) | $73,909 | $35.53 |
| Top Earners (P90) | $89,500 | $43.02 |
Median Salary Position
28.18% below the national average
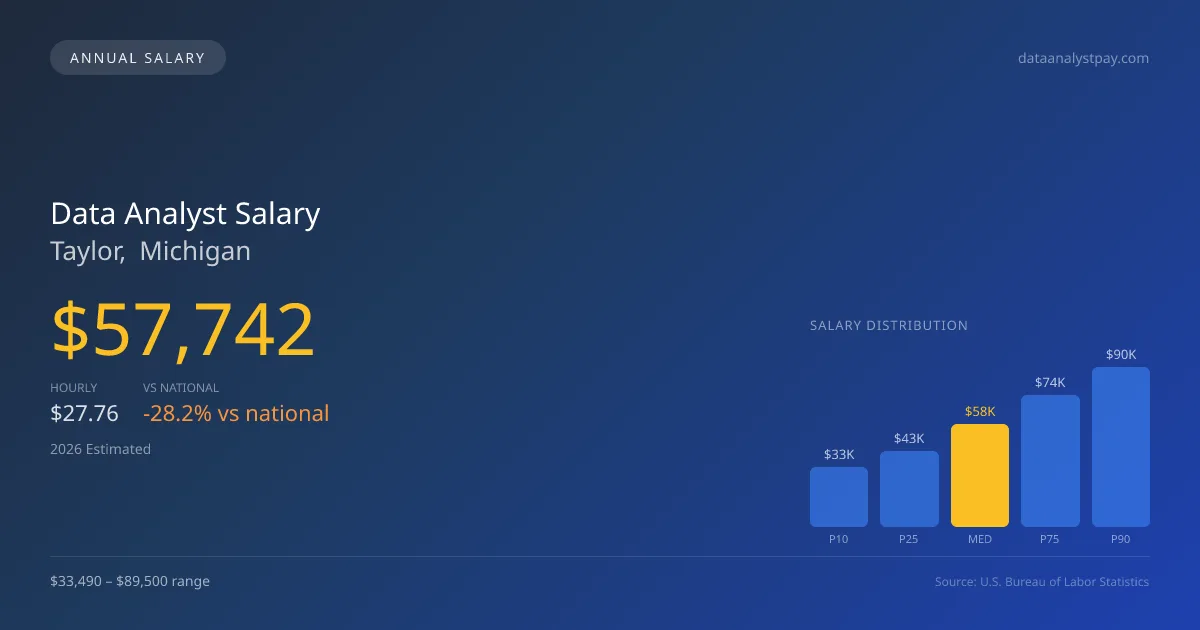
2026 Salary Percentile Distribution in Taylor
In Taylor, MI, the data analyst salary spread from the 10th to 90th percentile is $56,010 (2026 est.). At $57,742, the local median is 28.18% below the national median of $80,394.
Salary Calculator
At 40 hours/week in Taylor: You'd be in the lower-middle range
How Taylor Data Analyst Pay Compares
Taylor median: $57,742/year (2026)
| Compared To | Median Salary | Taylor Pays |
|---|---|---|
| Michigan Average | $58,266 | -0.90% less |
| National Average | $80,394 | -28.18% less |
Data Analysts in Taylor, MI earn a median of $57,742 per year (2026 est.), which is 28.18% lower than the national median of $80,394 and 0.90% below the Michigan state average of $58,266.
Cost-of-Living Adjusted Salary
Taylor has a cost of living 6.80% below the national average, meaning your salary goes further here.
Adjusted salary = nominal × (100 / CoL index). CoL index: 100 = national average.
Taylor, MI has a cost-of-living index of 93.2 (below the national average of 100). A data analyst earning $57,742 nominally has purchasing power equivalent to $61,955 in an average-cost city — an effective 7.3% boost.
Compare Purchasing Power
Select a city to see how your salary compares after cost of living
Select a city above to compare purchasing power
2021 BLS Actual
$46,385
2025 BLS Actual
$55,266
2026 Current Est.
$57,742
2021–2027 Growth
+30.1%
Salary Trajectory for Data Analysts in Taylor (2021–2027)
2021–2025: actual BLS OEWS data for this metro area. 2026+: CAGR 4.48% projection.
| Year | Annual Salary | Status |
|---|---|---|
| 2021 | $46,385 | Actual |
| 2022 | $47,576 | Actual |
| 2023 | $49,653 | Actual |
| 2024 | $96,955 | Actual |
| 2025 | $55,266 | Actual |
| 2026(current) | $57,742 | Estimated |
| 2027 | $60,329 | Projected |
Based on 5 years of BLS OEWS data for the Taylor metropolitan area, the median data analyst salary grew 19.1% from $46,385 (2021) to $55,266 (2025). At a 4.48% compound annual growth rate, salaries are projected to reach $60,329 by 2027 — a total increase of $13,944 (30.06%) from 2021.
Note: Historical values (2021–2025) are actual BLS OEWS figures for the Taylor metropolitan area, sourced from annual Occupational Employment and Wage Statistics surveys. 2026–2026 figures are current estimates, and 2027 values are projections, calculated using a 4.48% CAGR derived from 5-year BLS historical data. Actual salaries may vary based on employer, experience, certifications, and local market conditions.
Salary by Experience Level
| Experience | Estimated Salary Range |
|---|---|
| 0-2 years (New Graduate) | $33,490 – $42,650 |
| 3-5 years (Mid Career) | $42,650 – $57,742 |
| 5+ years (Experienced) | $57,742 – $73,909 |
| 10+ years (Top Earner) | $73,909 – $89,500 |
DA salary ranges estimated from BLS percentile data. Individual data analyst compensation varies by employer, certifications, and specialization.
Data Analyst Job Market in Taylor
Despite having only 16 data analysts currently employed in Taylor, the local market presents unique practical advantages, such as a cost-of-living index of 93.2, suggesting that salaries go further than in many other regions. This makes the effective take-home pay more appealing despite the lower salary scale compared to national averages. Employers like Amazon and smaller but innovative tech firms are likely to offer competitive compensation packages in areas like machine learning and analytics, especially when considering equity compensation and bonuses. The range in pay from low to high can largely be attributed to factors like company size, specific job function—such as favoring more technical machine learning roles over traditional data analyst positions—and experience level. For candidates wanting to maximize their compensation in Taylor, focusing on roles at tier-1 tech companies, building a strong portfolio of skills relevant to AI applications, and negotiating for equity will be crucial strategies.
More salary data for Taylor, MI:
Frequently Asked Questions
How much do data analysts make in Taylor, MI in 2026?
Is Taylor, MI a good place to work as a data analyst?
Can data analysts make $100K in Taylor?
What is the cost-of-living adjusted data analyst salary in Taylor?
How much does a data analyst make per hour in Taylor?
Related Pages
Compare Salaries
Career Resources
Nearby Cities in Michigan
Written by Aisha Patel, MA, Certified Data Analyst
Career Analyst
Aisha has 10 years of experience in data analysis. She specializes in business intelligence and works at a tech consulting firm.
Methodology & Data Source
Salary figures on this page are 2026 projections based on the Bureau of Labor Statistics Occupational Employment and Wage Statistics (OEWS) survey, May 2026 release. The BLS reported a median annual salary of $55,266 for data analystsin the Taylor metropolitan area. A 4.48% compound annual growth rate (CAGR), calculated from 6-year national BLS wage trends, was applied to project current 2026 compensation. Percentile ranges (P10–P90) represent the full salary distribution across experience levels and practice settings in this market.
Data Sources & Methodology
Salary data for Taylor is estimated from official BLS state-level occupational wage data (2025), adjusted for regional cost-of-living differences using BEA RPP (Regional Price Parities).
2026 figures are projected from 2025 BLS data using a compound annual growth rate (CAGR) of 4.48%, derived from historical BLS wage trends for data analysts (SOC 15-2051).
Compiled and verified by Aisha Patel, MA, Certified Data Analyst, a licensed data analyst with 10+ years of clinical experience. · View source data at BLS.gov