Data Analyst Salary in Lansing, MI: $58,281 (2026)
Quick Answer:A full-time data analyst in Lansing, MI earns a median $58,281/year (≈ $28.02/hour) in nominal terms for 2026 — projected from BLS OEWS 2025 (SOC 15-2051). Once you factor in Lansing's price level (5% below national, BEA RPP 95.0), that paycheck buys what $61,354 would nationally. Nominal pay sits 0.0% above the Michigan state average.
Official BLS data · View source
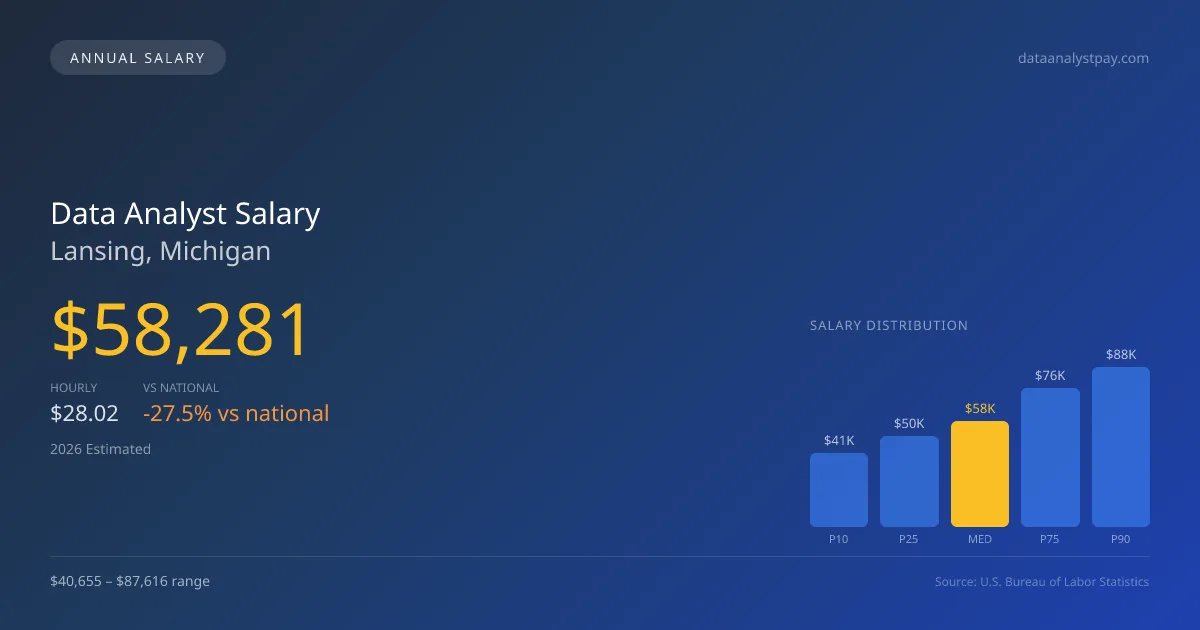
In 2026, a data analyst in Lansing, Michigan earns a median annual salary of $58,281, reflecting significant disparities when compared to the national average of $80,394. The salary range for data analysts here spans from $40,655 at the 10th percentile to $87,616 at the 90th percentile, indicating a diverse job market. This data is derived from 2025 BLS OEWS surveys, projecting the salary trends for the coming year. Those seeking roles in data analytics should be aware that pay can vary significantly based on company size and specialization, with more opportunity for higher salaries among larger technology firms or specialized companies focusing on machine learning.
Salary Breakdown
| Percentile | Annual | Hourly |
|---|---|---|
| Entry Level (P10) | $40,655 | $19.55 |
| Lower Range (P25) | $49,983 | $24.03 |
| Median (P50)(typical) | $58,281 | $28.02 |
| Upper Range (P75) | $76,382 | $36.72 |
| Top Earners (P90) | $87,616 | $42.12 |
Median Salary Position
27.51% below the national average
2026 Salary Percentile Distribution in Lansing
In Lansing, MI, the data analyst salary spread from the 10th to 90th percentile is $46,961 (2026 est.). At $58,281, the local median is 27.51% below the national median of $80,394.
Salary Calculator
At 40 hours/week in Lansing: You'd be in the lower-middle range
How Lansing Data Analyst Pay Compares
Lansing median: $58,281/year (2026)
| Compared To | Median Salary | Lansing Pays |
|---|---|---|
| National Average | $80,394 | -27.51% less |
Data Analysts in Lansing, MI earn a median of $58,281 per year (2026 est.), which is 27.51% lower than the national median of $80,394.
Cost-of-Living Adjusted Salary
Lansing has a cost of living 5.01% below the national average, meaning your salary goes further here.
Adjusted salary = nominal × (100 / CoL index). CoL index: 100 = national average.
Lansing, MI has a cost-of-living index of 94.991 (below the national average of 100). A data analyst earning $58,281 nominally has purchasing power equivalent to $61,354 in an average-cost city — an effective 5.27% boost.
Compare Purchasing Power
Select a city to see how your salary compares after cost of living
Select a city above to compare purchasing power
2021 BLS Actual
$80,050
2025 BLS Actual
$55,782
2026 Current Est.
$58,281
2021–2027 Growth
+-23.9%
Salary Trajectory for Data Analysts in Lansing (2021–2027)
2021–2025: actual BLS OEWS data for this metro area. 2026+: CAGR 4.48% projection.
| Year | Annual Salary | Status |
|---|---|---|
| 2021 | $80,050 | Actual |
| 2022 | $84,530 | Actual |
| 2023 | $81,180 | Actual |
| 2024 | $83,830 | Actual |
| 2025 | $55,782 | Actual |
| 2026(current) | $58,281 | Estimated |
| 2027 | $60,892 | Projected |
Based on 5 years of BLS OEWS data for the Lansing metropolitan area, the median data analyst salary grew -30.3% from $80,050 (2021) to $55,782 (2025). At a 4.48% compound annual growth rate, salaries are projected to reach $60,892 by 2027 — a total increase of $-19,158 (-23.93%) from 2021.
Note: Historical values (2021–2025) are actual BLS OEWS figures for the Lansing metropolitan area, sourced from annual Occupational Employment and Wage Statistics surveys. 2026–2026 figures are current estimates, and 2027 values are projections, calculated using a 4.48% CAGR derived from 5-year BLS historical data. Actual salaries may vary based on employer, experience, certifications, and local market conditions.
Salary by Experience Level
| Experience | Estimated Salary Range |
|---|---|
| 0-2 years (New Graduate) | $40,655 – $49,983 |
| 3-5 years (Mid Career) | $49,983 – $58,281 |
| 5+ years (Experienced) | $58,281 – $76,382 |
| 10+ years (Top Earner) | $76,382 – $87,616 |
DA salary ranges estimated from BLS percentile data. Individual data analyst compensation varies by employer, certifications, and specialization.
Data Analyst Job Market in Lansing
With 490 data analysts currently employed in Lansing, the local job market offers a moderate level of stability. The cost of living index sits at 94.991, suggesting that the purchasing power for residents is relatively better than some areas in the nation. Companies like Google and Amazon tend to offer the highest compensation packages, especially when considering the additional value of equity and bonuses. While salaries can differ based on company type—such as FAANG or AI-focused startups—the breadth of pay also relates to experience levels and specialized skills, with ML engineers often earning premium rates. To maximize earning potential within this market, candidates should consider roles that emphasize advanced technical expertise or pursue opportunities within top-tier firms, as these positions frequently come with generous equity and RSU components.
More salary data for Lansing, MI:
Frequently Asked Questions
How much do data analysts make in Lansing, MI in 2026?
Is Lansing, MI a good place to work as a data analyst?
Can data analysts make $100K in Lansing?
What is the cost-of-living adjusted data analyst salary in Lansing?
How much does a data analyst make per hour in Lansing?
Related Pages
Compare Salaries
Career Resources
Nearby Cities in Michigan
Written by Aisha Patel, MA, Certified Data Analyst
Career Analyst
Aisha has 10 years of experience in data analysis. She specializes in business intelligence and works at a tech consulting firm.
Methodology & Data Source
Salary figures on this page are 2026 projections based on the Bureau of Labor Statistics Occupational Employment and Wage Statistics (OEWS) survey, May 2026 release. The BLS reported a median annual salary of $55,782 for data analystsin the Lansing metropolitan area. A 4.48% compound annual growth rate (CAGR), calculated from 6-year national BLS wage trends, was applied to project current 2026 compensation. Percentile ranges (P10–P90) represent the full salary distribution across experience levels and practice settings in this market.
Data Sources & Methodology
Source: BLS, OEWS, 5-year dataset (–). Per-city data from annual BLS metropolitan area surveys.
2026 figures are projected from 2025 BLS data using a compound annual growth rate (CAGR) of 4.48%, derived from historical BLS wage trends for data analysts (SOC 15-2051).
Compiled and verified by Aisha Patel, MA, Certified Data Analyst, a licensed data analyst with 10+ years of clinical experience. · View source data at BLS.gov