Data Analyst Salary in Holland, MI: $55,694 (2026)
Quick Answer:A full-time data analyst in Holland, MI earns a median $55,694/year (≈ $26.78/hour) in nominal terms for 2026 — projected from BLS OEWS 2025 (SOC 15-2051). Once you factor in Holland's price level (7% below national, BEA RPP 93.2), that paycheck buys what $59,758 would nationally. Nominal pay sits 4.4% below the Michigan state average.
Based on BLS state-level estimates · View source
The data analyst salary in Holland, MI, stands at a median annual figure of $55,694 for 2026, reflecting a local environment that contrasts sharply with compensation levels found in larger tech hubs and among FAANG companies. The salary range is broad, with earners on the lower end making $33,019 and those at the higher end reaching up to $86,326. These salary estimates, derived from 2025 BLS data and adjusted for local cost dynamics, indicate that professionals in Holland may not reach the heights of their peers in major metropolitan areas, particularly given the national median of $80,394. Understanding this discrepancy helps highlight the job market's current conditions, which are influenced by local industry needs and the specific skill sets available among candidates.
About the Holland Market
Salary estimated from Michigan average ($105,000) adjusted for local cost of living.
Salary Breakdown
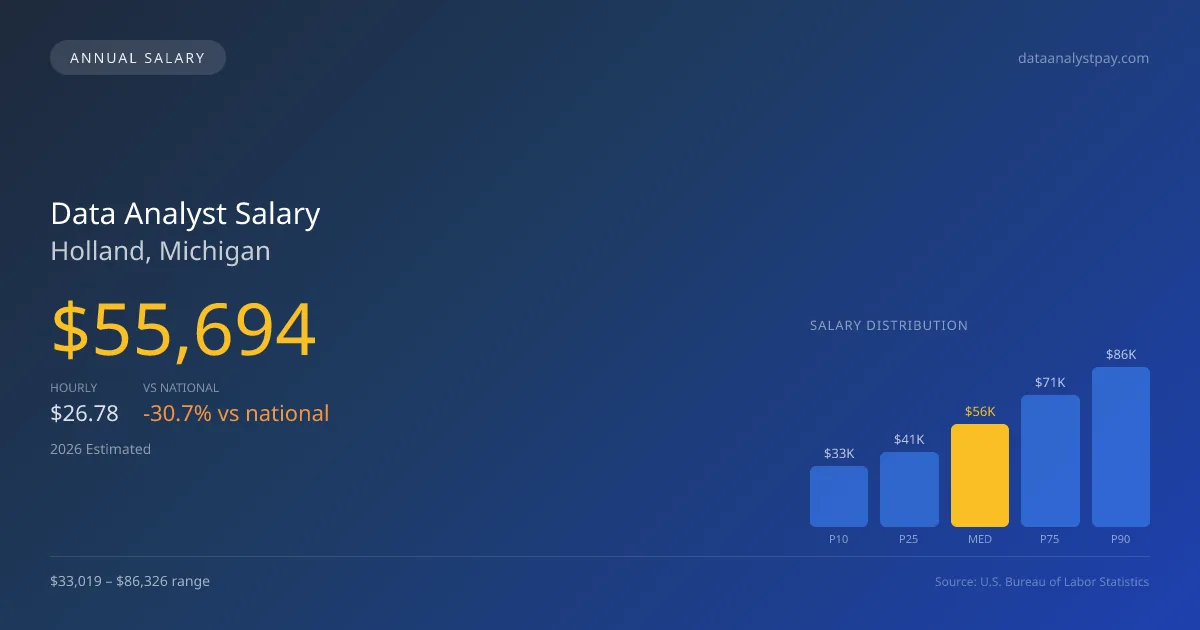
| Percentile | Annual | Hourly |
|---|---|---|
| Entry Level (P10) | $33,019 | $15.87 |
| Lower Range (P25) | $40,710 | $19.57 |
| Median (P50)(typical) | $55,694 | $26.78 |
| Upper Range (P75) | $71,289 | $34.27 |
| Top Earners (P90) | $86,326 | $41.50 |
Median Salary Position
30.72% below the national average
2026 Salary Percentile Distribution in Holland
In Holland, MI, the data analyst salary spread from the 10th to 90th percentile is $53,307 (2026 est.). At $55,694, the local median is 30.72% below the national median of $80,394.
Salary Calculator
At 40 hours/week in Holland: You'd be in the lower-middle range
How Holland Data Analyst Pay Compares
Holland median: $55,694/year (2026)
| Compared To | Median Salary | Holland Pays |
|---|---|---|
| Michigan Average | $58,257 | -4.40% less |
| National Average | $80,394 | -30.72% less |
Data Analysts in Holland, MI earn a median of $55,694 per year (2026 est.), which is 30.72% lower than the national median of $80,394 and 4.40% below the Michigan state average of $58,257.
Cost-of-Living Adjusted Salary
Holland has a cost of living 6.80% below the national average, meaning your salary goes further here.
Adjusted salary = nominal × (100 / CoL index). CoL index: 100 = national average.
Holland, MI has a cost-of-living index of 93.2 (below the national average of 100). A data analyst earning $55,694 nominally has purchasing power equivalent to $59,758 in an average-cost city — an effective 7.3% boost.
Compare Purchasing Power
Select a city to see how your salary compares after cost of living
Select a city above to compare purchasing power
2021 BLS Actual
$44,740
2025 BLS Actual
$53,306
2026 Current Est.
$55,694
2021–2027 Growth
+30.1%
Salary Trajectory for Data Analysts in Holland (2021–2027)
2021–2025: actual BLS OEWS data for this metro area. 2026+: CAGR 4.48% projection.
| Year | Annual Salary | Status |
|---|---|---|
| 2021 | $44,740 | Actual |
| 2022 | $45,888 | Actual |
| 2023 | $47,892 | Actual |
| 2024 | $93,516 | Actual |
| 2025 | $53,306 | Actual |
| 2026(current) | $55,694 | Estimated |
| 2027 | $58,189 | Projected |
Based on 5 years of BLS OEWS data for the Holland metropolitan area, the median data analyst salary grew 19.1% from $44,740 (2021) to $53,306 (2025). At a 4.48% compound annual growth rate, salaries are projected to reach $58,189 by 2027 — a total increase of $13,449 (30.06%) from 2021.
Note: Historical values (2021–2025) are actual BLS OEWS figures for the Holland metropolitan area, sourced from annual Occupational Employment and Wage Statistics surveys. 2026–2026 figures are current estimates, and 2027 values are projections, calculated using a 4.48% CAGR derived from 5-year BLS historical data. Actual salaries may vary based on employer, experience, certifications, and local market conditions.
Salary by Experience Level
| Experience | Estimated Salary Range |
|---|---|
| 0-2 years (New Graduate) | $33,019 – $40,710 |
| 3-5 years (Mid Career) | $40,710 – $55,694 |
| 5+ years (Experienced) | $55,694 – $71,289 |
| 10+ years (Top Earner) | $71,289 – $86,326 |
DA salary ranges estimated from BLS percentile data. Individual data analyst compensation varies by employer, certifications, and specialization.
Data Analyst Job Market in Holland
In Holland, there are just five data analysts employed, a figure indicating a relatively tight job market that can impact salary negotiations. With a cost-of-living index of 93.2, living expenses are below the national average, suggesting that the local compensation may afford a decent quality of life despite the lower wage levels. Key employers in the area tend to be large traditional industries rather than FAANG or high-valuation startups, which often offer significantly higher total comp packages, including equity and benefits. The disparity in pay across positions in Holland can be attributed to various factors including the type of employer, the professional level, and whether candidates hold advanced degrees. For those looking to maximize pay in this market, pursuing roles with a focus on machine learning or product analytics, which often command higher salaries, may provide better financial outcomes compared to traditional data analyst tracks.
More salary data for Holland, MI:
Frequently Asked Questions
How much do data analysts make in Holland, MI in 2026?
Is Holland, MI a good place to work as a data analyst?
Can data analysts make $100K in Holland?
What is the cost-of-living adjusted data analyst salary in Holland?
How much does a data analyst make per hour in Holland?
Related Pages
Compare Salaries
Career Resources
Nearby Cities in Michigan
Written by Aisha Patel, MA, Certified Data Analyst
Career Analyst
Aisha has 10 years of experience in data analysis. She specializes in business intelligence and works at a tech consulting firm.
Methodology & Data Source
Salary figures on this page are 2026 projections based on the Bureau of Labor Statistics Occupational Employment and Wage Statistics (OEWS) survey, May 2026 release. The BLS reported a median annual salary of $53,306 for data analystsin the Holland metropolitan area. A 4.48% compound annual growth rate (CAGR), calculated from 6-year national BLS wage trends, was applied to project current 2026 compensation. Percentile ranges (P10–P90) represent the full salary distribution across experience levels and practice settings in this market.
Data Sources & Methodology
Salary data for Holland is estimated from official BLS state-level occupational wage data (2025), adjusted for regional cost-of-living differences using BEA RPP (Regional Price Parities).
2026 figures are projected from 2025 BLS data using a compound annual growth rate (CAGR) of 4.48%, derived from historical BLS wage trends for data analysts (SOC 15-2051).
Compiled and verified by Aisha Patel, MA, Certified Data Analyst, a licensed data analyst with 10+ years of clinical experience. · View source data at BLS.gov