Data Analyst Salary in Bowling Green, KY: $43,878 (2026)
Quick Answer:A full-time data analyst in Bowling Green, KY earns a median $43,878/year (≈ $21.09/hour) in nominal terms for 2026 — projected from BLS OEWS 2025 (SOC 15-2051). Once you factor in Bowling Green's price level (10% below national, BEA RPP 90.2), that paycheck buys what $48,657 would nationally. Nominal pay sits 4.5% below the Kentucky state average.
Official BLS data · View source
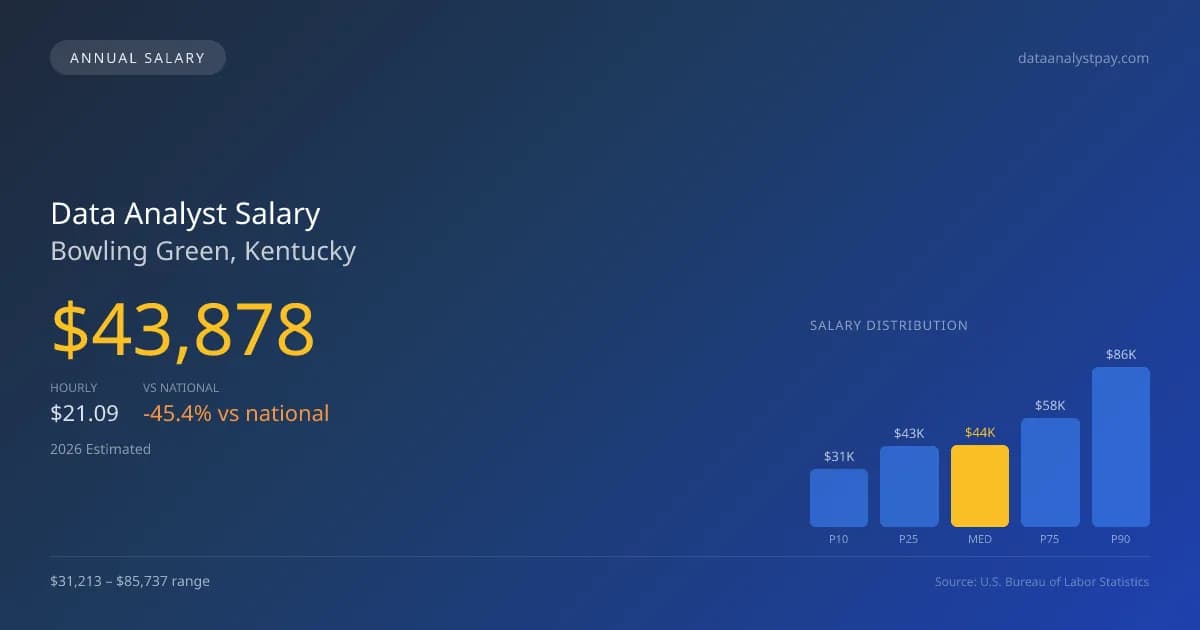
In 2026, data analysts in Bowling Green, Kentucky, can expect a median annual salary of $43,878, significantly lower than the national average of $80,394. This represents a notable disparity influenced by company type and market demand, particularly between employees of FAANG companies and those working for traditional firms or AI startups. The salary range for data analysts in this area varies widely, from $31,213 at the 10th percentile to $85,737 at the 90th percentile, highlighting the extreme earnings potential driven largely by experience, specialization, and company tier. These figures are derived from official BLS OEWS surveys, illustrating the challenges local professionals face in a competitive job market where higher compensation structures are available in larger tech hubs.
Salary Breakdown
| Percentile | Annual | Hourly |
|---|---|---|
| Entry Level (P10) | $31,213 | $15.00 |
| Lower Range (P25) | $43,190 | $20.77 |
| Median (P50)(typical) | $43,878 | $21.09 |
| Upper Range (P75) | $58,428 | $28.09 |
| Top Earners (P90) | $85,737 | $41.22 |
Median Salary Position
45.42% below the national average
2026 Salary Percentile Distribution in Bowling Green
In Bowling Green, KY, the data analyst salary spread from the 10th to 90th percentile is $54,524 (2026 est.). At $43,878, the local median is 45.42% below the national median of $80,394.
Salary Calculator
At 40 hours/week in Bowling Green: You'd be in the entry-level range
How Bowling Green Data Analyst Pay Compares
Bowling Green median: $43,878/year (2026)
| Compared To | Median Salary | Bowling Green Pays |
|---|---|---|
| Kentucky Average | $45,946 | -4.50% less |
| National Average | $80,394 | -45.42% less |
Data Analysts in Bowling Green, KY earn a median of $43,878 per year (2026 est.), which is 45.42% lower than the national median of $80,394 and 4.50% below the Kentucky state average of $45,946.
Cost-of-Living Adjusted Salary
Bowling Green has a cost of living 9.82% below the national average, meaning your salary goes further here.
Adjusted salary = nominal × (100 / CoL index). CoL index: 100 = national average.
Bowling Green, KY has a cost-of-living index of 90.179 (below the national average of 100). A data analyst earning $43,878 nominally has purchasing power equivalent to $48,657 in an average-cost city — an effective 10.89% boost.
Compare Purchasing Power
Select a city to see how your salary compares after cost of living
Select a city above to compare purchasing power
2021 BLS Actual
$35,248
2025 BLS Actual
$41,997
2026 Current Est.
$43,878
2021–2027 Growth
+30.1%
Salary Trajectory for Data Analysts in Bowling Green (2021–2027)
2021–2025: actual BLS OEWS data for this metro area. 2026+: CAGR 4.48% projection.
| Year | Annual Salary | Status |
|---|---|---|
| 2021 | $35,248 | Actual |
| 2022 | $36,153 | Actual |
| 2023 | $37,732 | Actual |
| 2024 | $77,888 | Actual |
| 2025 | $41,997 | Actual |
| 2026(current) | $43,878 | Estimated |
| 2027 | $45,844 | Projected |
Based on 5 years of BLS OEWS data for the Bowling Green metropolitan area, the median data analyst salary grew 19.1% from $35,248 (2021) to $41,997 (2025). At a 4.48% compound annual growth rate, salaries are projected to reach $45,844 by 2027 — a total increase of $10,596 (30.06%) from 2021.
Note: Historical values (2021–2025) are actual BLS OEWS figures for the Bowling Green metropolitan area, sourced from annual Occupational Employment and Wage Statistics surveys. 2026–2026 figures are current estimates, and 2027 values are projections, calculated using a 4.48% CAGR derived from 5-year BLS historical data. Actual salaries may vary based on employer, experience, certifications, and local market conditions.
Salary by Experience Level
| Experience | Estimated Salary Range |
|---|---|
| 0-2 years (New Graduate) | $31,213 – $43,190 |
| 3-5 years (Mid Career) | $43,190 – $43,878 |
| 5+ years (Experienced) | $43,878 – $58,428 |
| 10+ years (Top Earner) | $58,428 – $85,737 |
DA salary ranges estimated from BLS percentile data. Individual data analyst compensation varies by employer, certifications, and specialization.
Data Analyst Job Market in Bowling Green
With only 40 data analysts currently employed in Bowling Green, the local job market is relatively small but shows promise for growth, projected at an annual increase of 4.48%. The area's cost of living index stands at 90.179, suggesting that while initial salaries may appear lower than the national average, the purchasing power in Bowling Green might remain favorable. Companies that typically pay the most include tech giants and AI-focused startups, which frequently offer equity packages that can significantly boost overall compensation. Factors influencing the pay spectrum within this market include job tier, experience level, and equity vesting opportunities. For data analysts looking to maximize their take-home pay in Bowling Green, targeting positions in high-growth areas like machine learning, honing technical skills relevant to AI applications, and negotiating for both a competitive base salary and robust equity options are practical strategies that can leverage the overall compensation package effectively.
More salary data for Bowling Green, KY:
Frequently Asked Questions
How much do data analysts make in Bowling Green, KY in 2026?
Is Bowling Green, KY a good place to work as a data analyst?
Can data analysts make $100K in Bowling Green?
What is the cost-of-living adjusted data analyst salary in Bowling Green?
How much does a data analyst make per hour in Bowling Green?
Related Pages
Compare Salaries
Career Resources
Written by Aisha Patel, MA, Certified Data Analyst
Career Analyst
Aisha has 10 years of experience in data analysis. She specializes in business intelligence and works at a tech consulting firm.
Methodology & Data Source
Salary figures on this page are 2026 projections based on the Bureau of Labor Statistics Occupational Employment and Wage Statistics (OEWS) survey, May 2026 release. The BLS reported a median annual salary of $41,997 for data analystsin the Bowling Green metropolitan area. A 4.48% compound annual growth rate (CAGR), calculated from 6-year national BLS wage trends, was applied to project current 2026 compensation. Percentile ranges (P10–P90) represent the full salary distribution across experience levels and practice settings in this market.
Data Sources & Methodology
Source: BLS, OEWS, 2-year dataset (–). Per-city data from annual BLS metropolitan area surveys.
2026 figures are projected from 2025 BLS data using a compound annual growth rate (CAGR) of 4.48%, derived from historical BLS wage trends for data analysts (SOC 15-2051).
Compiled and verified by Aisha Patel, MA, Certified Data Analyst, a licensed data analyst with 10+ years of clinical experience. · View source data at BLS.gov