Data Analyst Salary in Lynchburg, VA: $70,329 (2026)
Quick Answer:A full-time data analyst in Lynchburg, VA earns a median $70,329/year (≈ $33.81/hour) in nominal terms for 2026 — projected from BLS OEWS 2025 (SOC 15-2051). Once you factor in Lynchburg's price level (3% above national, BEA RPP 103.2), that paycheck buys what $68,148 would nationally. Nominal pay sits 0.9% below the Virginia state average.
Based on BLS state-level estimates · View source
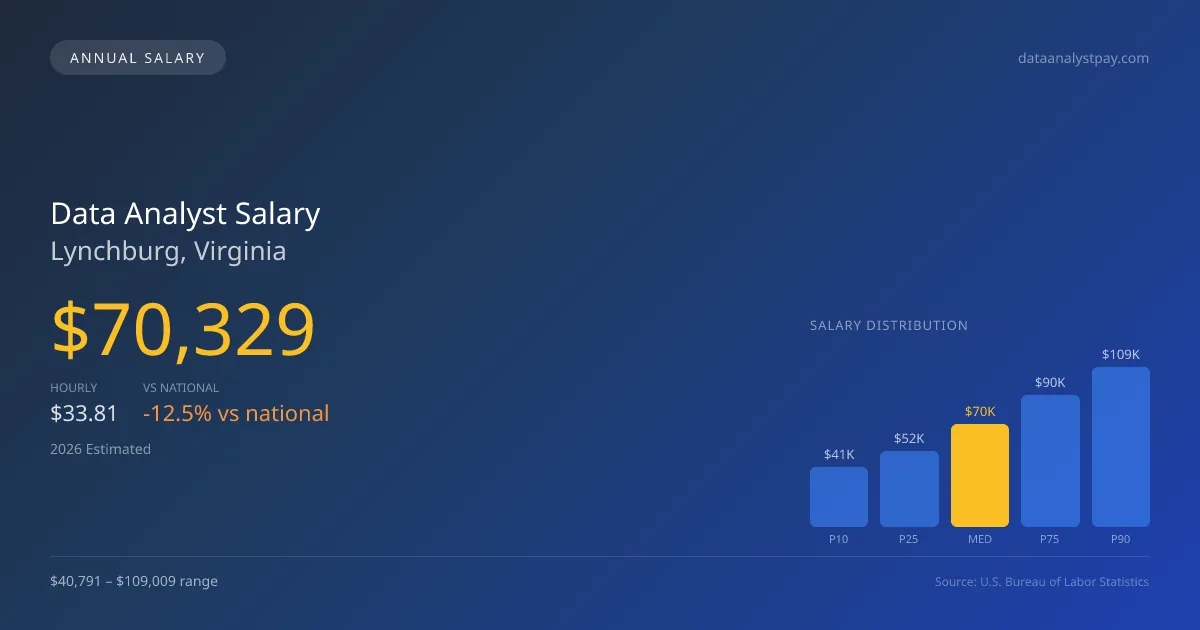
Data analyst salaries in Lynchburg, Virginia are projected to reach a median annual figure of $70,329 in 2026, reflecting the local market's competitive nature within the broader tech landscape. With a salary range extending from $40,791 at the 10th percentile to $109,009 at the 90th percentile, this city offers a variety of compensation opportunities depending on experience and specialization. Local estimates derived from BLS state-level data and regional price adjustments illustrate the nuances in earning potential among data analysts. Compared to the national median of $80,394, these figures indicate that Lynchburg's salaries lag by about 12.52%. However, this market maintains a steady growth rate of 4.48% annually, paving the way for increased earning potential as demand for data expertise continues to rise.
About the Lynchburg Market
Salary estimated from Virginia average ($128,000) adjusted for local cost of living.
Salary Breakdown
| Percentile | Annual | Hourly |
|---|---|---|
| Entry Level (P10) | $40,791 | $19.61 |
| Lower Range (P25) | $52,001 | $25.00 |
| Median (P50)(typical) | $70,329 | $33.81 |
| Upper Range (P75) | $90,021 | $43.28 |
| Top Earners (P90) | $109,009 | $52.41 |
Median Salary Position
12.52% below the national average
2026 Salary Percentile Distribution in Lynchburg
In Lynchburg, VA, the data analyst salary spread from the 10th to 90th percentile is $68,218 (2026 est.). At $70,329, the local median is 12.52% below the national median of $80,394.
Salary Calculator
At 40 hours/week in Lynchburg: You'd be in the lower-middle range
How Lynchburg Data Analyst Pay Compares
Lynchburg median: $70,329/year (2026)
| Compared To | Median Salary | Lynchburg Pays |
|---|---|---|
| Virginia Average | $70,967 | -0.90% less |
| National Average | $80,394 | -12.52% less |
Data Analysts in Lynchburg, VA earn a median of $70,329 per year (2026 est.), which is 12.52% lower than the national median of $80,394 and 0.90% below the Virginia state average of $70,967.
Cost-of-Living Adjusted Salary
Lynchburg has a cost of living 3.20% above the national average.
Adjusted salary = nominal × (100 / CoL index). CoL index: 100 = national average.
Lynchburg, VA has a cost-of-living index of 103.2 (above the national average of 100). While the nominal salary of $70,329 is competitive, the higher cost of living reduces purchasing power to an effective $68,148 — a 3.1% reduction.
Compare Purchasing Power
Select a city to see how your salary compares after cost of living
Select a city above to compare purchasing power
2021 BLS Actual
$56,496
2025 BLS Actual
$67,313
2026 Current Est.
$70,329
2021–2027 Growth
+30.1%
Salary Trajectory for Data Analysts in Lynchburg (2021–2027)
2021–2025: actual BLS OEWS data for this metro area. 2026+: CAGR 4.48% projection.
| Year | Annual Salary | Status |
|---|---|---|
| 2021 | $56,496 | Actual |
| 2022 | $57,946 | Actual |
| 2023 | $60,477 | Actual |
| 2024 | $108,980 | Actual |
| 2025 | $67,313 | Actual |
| 2026(current) | $70,329 | Estimated |
| 2027 | $73,479 | Projected |
Based on 5 years of BLS OEWS data for the Lynchburg metropolitan area, the median data analyst salary grew 19.1% from $56,496 (2021) to $67,313 (2025). At a 4.48% compound annual growth rate, salaries are projected to reach $73,479 by 2027 — a total increase of $16,983 (30.06%) from 2021.
Note: Historical values (2021–2025) are actual BLS OEWS figures for the Lynchburg metropolitan area, sourced from annual Occupational Employment and Wage Statistics surveys. 2026–2026 figures are current estimates, and 2027 values are projections, calculated using a 4.48% CAGR derived from 5-year BLS historical data. Actual salaries may vary based on employer, experience, certifications, and local market conditions.
Salary by Experience Level
| Experience | Estimated Salary Range |
|---|---|
| 0-2 years (New Graduate) | $40,791 – $52,001 |
| 3-5 years (Mid Career) | $52,001 – $70,329 |
| 5+ years (Experienced) | $70,329 – $90,021 |
| 10+ years (Top Earner) | $90,021 – $109,009 |
DA salary ranges estimated from BLS percentile data. Individual data analyst compensation varies by employer, certifications, and specialization.
Data Analyst Job Market in Lynchburg
Currently, only 12 data analysts are employed within Lynchburg, highlighting a tight-knit local job market. Coupled with a cost-of-living index of 103.2, which slightly exceeds the national average, analysts must consider their total compensation carefully to optimize take-home pay. While local firms may not compete on salary with prominent tech companies like FAANG, those seeking higher compensation should target AI-oriented startups or specialized consulting firms that may offer equity or performance bonuses. The disparity in salaries stems from several factors, including the tier of the hiring organization, required qualifications, and the compensation structure typically associated with data science roles. For those analyzing how much do data analysts make in Lynchburg, understanding the specific employer landscape, targeting opportunities with higher equity stakes, and considering roles focused on machine learning or advanced analytics can significantly enhance earning potential in this market.
More salary data for Lynchburg, VA:
Frequently Asked Questions
How much do data analysts make in Lynchburg, VA in 2026?
Is Lynchburg, VA a good place to work as a data analyst?
Can data analysts make $100K in Lynchburg?
What is the cost-of-living adjusted data analyst salary in Lynchburg?
How much does a data analyst make per hour in Lynchburg?
Related Pages
Compare Salaries
Career Resources
Nearby Cities in Virginia
Written by Aisha Patel, MA, Certified Data Analyst
Career Analyst
Aisha has 10 years of experience in data analysis. She specializes in business intelligence and works at a tech consulting firm.
Methodology & Data Source
Salary figures on this page are 2026 projections based on the Bureau of Labor Statistics Occupational Employment and Wage Statistics (OEWS) survey, May 2026 release. The BLS reported a median annual salary of $67,313 for data analystsin the Lynchburg metropolitan area. A 4.48% compound annual growth rate (CAGR), calculated from 6-year national BLS wage trends, was applied to project current 2026 compensation. Percentile ranges (P10–P90) represent the full salary distribution across experience levels and practice settings in this market.
Data Sources & Methodology
Salary data for Lynchburg is estimated from official BLS state-level occupational wage data (2025), adjusted for regional cost-of-living differences using BEA RPP (Regional Price Parities).
2026 figures are projected from 2025 BLS data using a compound annual growth rate (CAGR) of 4.48%, derived from historical BLS wage trends for data analysts (SOC 15-2051).
Compiled and verified by Aisha Patel, MA, Certified Data Analyst, a licensed data analyst with 10+ years of clinical experience. · View source data at BLS.gov