Data Analyst Salary in Ohio: $67,985 (2026)
Quick Answer:Across Ohio's 67 metropolitan areas, the average median data analyst pay sits at $67,985/year heading into 2026 — a figure projected from 2025 BLS OEWS wage data for SOC 15-2051. Because Ohio sits at BEA RPP 90.7 (9% below the U.S. baseline), that statewide median translates to roughly $74,956 in nationally-comparable purchasing power. Highest-paying metros: Columbus ($69,088), Cincinnati ($65,696), Cleveland ($65,190).
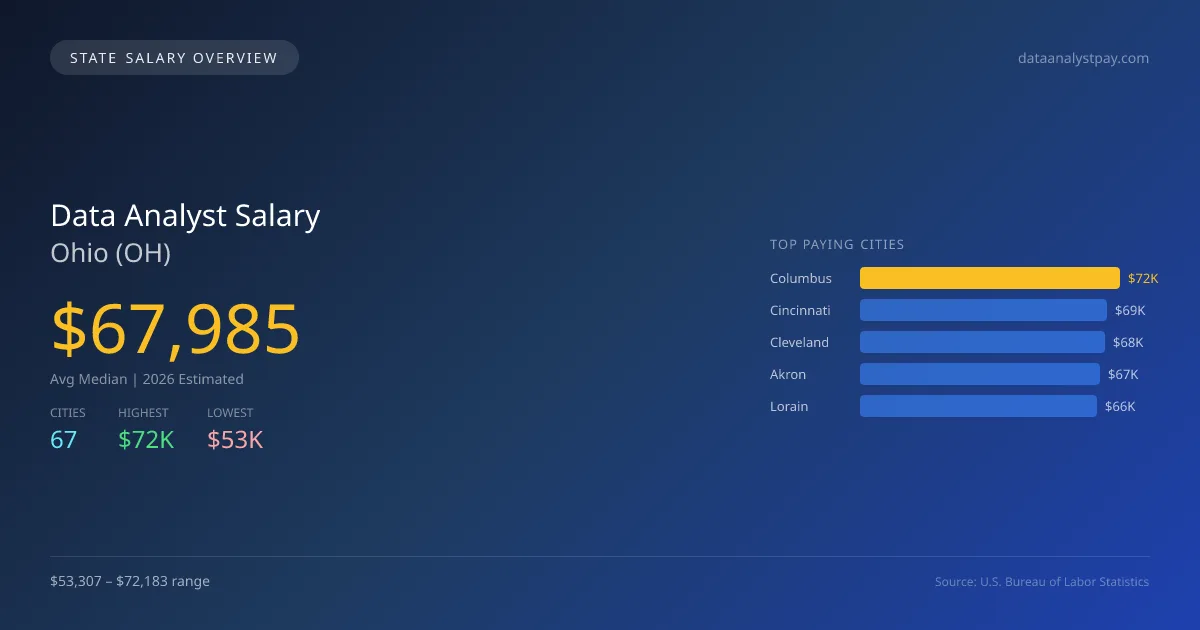
When considering a career as a data analyst in Ohio, it's important to note that the 2026 average median salary is projected to be $67,984, which is 15.4% lower than the national median of $80,394. The highest paying city for data analysts in the state is Columbus, with a salary of $72,183, while Youngstown represents the lowest at $53,307. This significant salary gap can be attributed to various factors, including the concentration of industries, demand for data analysts, and the cost of living in these regions. Ohio has no specific state licensing requirements for data analysts, which allows for a wider entry into the field. The projected annual growth rate for data analyst positions is 4.48%, indicating a steady demand for professionals in this area. The top five cities for salary in 2026 are Columbus ($72,183), Cincinnati ($68,639), Cleveland ($68,111), Akron ($66,720), and Lorain ($65,696). Factors driving demand include the ongoing digital transformation across sectors, particularly in technology and healthcare. As businesses increasingly rely on data-driven decisions, the outlook for data analysts remains positive across Ohio's diverse economy.
Ohio Data Analyst Salary Range
Overall salary range in Ohio: $25,176 (lowest entry-level) to $113,259 (highest top earner)
Ohio vs National Average
Ohio data analysts earn 15.44% less than the national median ($-12,409/year difference).
Ohio Data Analyst Salary Distribution (2026)
Data Analyst salaries in Ohio range from $41,270 (entry-level, 10th percentile) to $104,055 (top earners, 90th percentile), with a median of $67,985. The Ohio median is $12,409 below the US national median of $80,394. The average hourly rate is $32.68/hr. Approximately 5,719 data analysts are employed across 67 cities.
2021 BLS Actual
$88,043
2025 BLS Actual
$65,069
2026 Current Est.
$67,985
2021–2027 Growth
+-19.3%
Salary Trajectory for Data Analysts in Ohio (2021–2027)
2021–2025: actual BLS OEWS data for this metro area. 2026+: CAGR 4.48% projection.
| Year | Annual Salary | Status |
|---|---|---|
| 2021 | $88,043 | Actual |
| 2022 | $93,356 | Actual |
| 2023 | $96,169 | Actual |
| 2024 | $97,273 | Actual |
| 2025 | $65,069 | Actual |
| 2026(current) | $67,985 | Estimated |
| 2027 | $71,030 | Projected |
Based on 5 years of BLS OEWS data for the Ohio metropolitan area, the median data analyst salary grew -26.1% from $88,043 (2021) to $65,069 (2025). At a 4.48% compound annual growth rate, salaries are projected to reach $71,030 by 2027 — a total increase of $-17,013 (-19.32%) from 2021.
Note: Historical values (2021–2025) are actual BLS OEWS figures for the Ohio metropolitan area, sourced from annual Occupational Employment and Wage Statistics surveys. 2026–2026 figures are current estimates, and 2027 values are projections, calculated using a 4.48% CAGR derived from 5-year BLS historical data. Actual salaries may vary based on employer, experience, certifications, and local market conditions.
Top 5 Highest Paying Cities in Ohio
Lowest Paying Cities in Ohio
| City | Median Salary |
|---|---|
| Youngstown | $53,307 |
| Warren | $53,436 |
| Toledo | $54,831 |
| Massillon | $58,117 |
| Canton | $58,916 |
Best Value Cities for Data Analysts in Ohio
When adjusted for local cost of living, these Ohio cities offer the most purchasing power for data analysts.
| City | Nominal Salary | CoL Index | Adjusted Salary |
|---|---|---|---|
| Columbus | $72,183 | 95.469 | $75,609 |
| Cleveland | $68,111 | 93.923 | $72,518 |
| Lorain | $65,696 | 90.7 | $72,432 |
| Springfield | $65,573 | 90.7 | $72,297 |
| Parma | $65,516 | 90.7 | $72,234 |
Adjusted salary = nominal salary × (100 / CoL index). CoL index: 100 = national average. Lower index = lower cost of living.
Salary by Experience Level in Ohio
| Experience Level | Estimated Annual |
|---|---|
| Entry Level (0-2 years) | $41,270 |
| Mid Career (3-7 years) | $67,985 |
| Experienced (7+ years) | $104,055 |
Estimates based on BLS percentile data averaged across Ohio metro areas. Individual pay varies by employer, certifications, and specialization.
All 67 Cities in Ohio
| # | City | Median Salary |
|---|---|---|
| 1 | Columbus | $72,183 |
| 2 | Cincinnati | $68,639 |
| 3 | Cleveland | $68,111 |
| 4 | Akron | $66,720 |
| 5 | Lorain | $65,696 |
| 6 | Springfield | $65,573 |
| 7 | Parma | $65,516 |
| 8 | Cuyahoga Falls | $65,249 |
| 9 | Hamilton | $65,022 |
| 10 | Lakewood | $64,667 |
| 11 | Sandusky | $64,591 |
| 12 | Bowling Green | $64,581 |
| 13 | Lancaster | $64,560 |
| 14 | Zanesville | $64,556 |
| 15 | Westlake | $64,444 |
| 16 | Middletown | $64,419 |
| 17 | Grove City | $64,233 |
| 18 | Delaware | $64,182 |
| 19 | Gahanna | $64,173 |
| 20 | Westerville | $64,132 |
| 21 | Huber Heights | $63,980 |
| 22 | Lima | $63,935 |
| 23 | North Ridgeville | $63,930 |
| 24 | North Royalton | $63,839 |
| 25 | North Olmsted | $63,613 |
| 26 | Reynoldsburg | $63,502 |
| 27 | Beavercreek | $63,368 |
| 28 | Strongsville | $63,290 |
| 29 | Dayton | $63,270 |
| 30 | Mansfield | $63,224 |
| 31 | Brunswick | $62,896 |
| 32 | Wooster | $62,896 |
| 33 | Elyria | $62,798 |
| 34 | Shaker Heights | $62,670 |
| 35 | Medina | $62,629 |
| 36 | Dublin | $62,427 |
| 37 | Fairfield | $62,423 |
| 38 | Kettering | $62,417 |
| 39 | Mentor | $62,357 |
| 40 | Mason | $62,084 |
| 41 | Avon | $62,007 |
| 42 | Marion | $61,913 |
| 43 | Stow | $61,908 |
| 44 | Newark | $61,872 |
| 45 | Findlay | $61,807 |
| 46 | Green | $61,711 |
| 47 | Barberton | $61,711 |
| 48 | Austintown | $61,686 |
| 49 | Cleveland Heights | $61,676 |
| 50 | Upper Arlington | $61,595 |
| 51 | Xenia | $61,595 |
| 52 | Hilliard | $61,519 |
| 53 | Oxford | $61,328 |
| 54 | Chillicothe | $61,195 |
| 55 | Perrysburg | $60,970 |
| 56 | Trotwood | $60,952 |
| 57 | Athens | $60,306 |
| 58 | Tiffin | $59,968 |
| 59 | Wadsworth | $59,919 |
| 60 | Avon Lake | $59,875 |
| 61 | Centerville | $59,744 |
| 62 | Solon | $59,734 |
| 63 | Canton | $58,916 |
| 64 | Massillon | $58,117 |
| 65 | Toledo | $54,831 |
| 66 | Warren | $53,436 |
| 67 | Youngstown | $53,307 |
More Ohio Salary Data
Senior / Experienced
Top earner salaries for experienced data analysts.
Compare Cities in Ohio
View all comparisons →Explore More Data Analyst Salary Data
Frequently Asked Questions
How much do data analysts make in Ohio in 2026?
What is the highest paying city for data analysts in Ohio?
How does Ohio data analyst pay compare to the national average?
What is the entry-level data analyst salary in Ohio?
How many data analysts are employed in Ohio?
Which Ohio city offers the best value for data analysts?
Written by Aisha Patel, MA, Certified Data Analyst
Career Analyst
Aisha has 10 years of experience in data analysis. She specializes in business intelligence and works at a tech consulting firm.
Methodology & Data Source
Statewide salary figures on this page are 2026 projections based on the Bureau of Labor Statistics Occupational Employment and Wage Statistics (OEWS) survey, May 2026 release. A 4.48% compound annual growth rate (CAGR), derived from 6-year national BLS wage trends, was applied to each metro area's reported salary to estimate current 2026 data analyst compensation across Ohio. State averages are employment-weighted across 67 metro areas — larger metro areas with more data analystscontribute proportionally more to the average, producing figures that better reflect typical compensation. Individual pay varies by city, employer, certifications, and experience.
Data Sources & Methodology
Source: BLS, OEWS, 5-year dataset (–). Per-city data from annual BLS metropolitan area surveys.
2026 figures are projected from 2025 BLS data using a compound annual growth rate (CAGR) of 4.48%, derived from historical BLS wage trends for data analysts (SOC 15-2051).
Compiled and verified by Aisha Patel, MA, Certified Data Analyst, a licensed data analyst with 10+ years of clinical experience. · View source data at BLS.gov