Data Analyst Salary in New York: $87,035 (2026)
Quick Answer:Across New York's 39 metropolitan areas, the average median data analyst pay sits at $87,035/year heading into 2026 — a figure projected from 2025 BLS OEWS wage data for SOC 15-2051. Because New York sits at BEA RPP 115.9 (16% above the U.S. baseline), that statewide median translates to roughly $75,095 in nationally-comparable purchasing power. Highest-paying metros: New York ($87,027), Poughkeepsie ($69,736), Syracuse ($69,555).
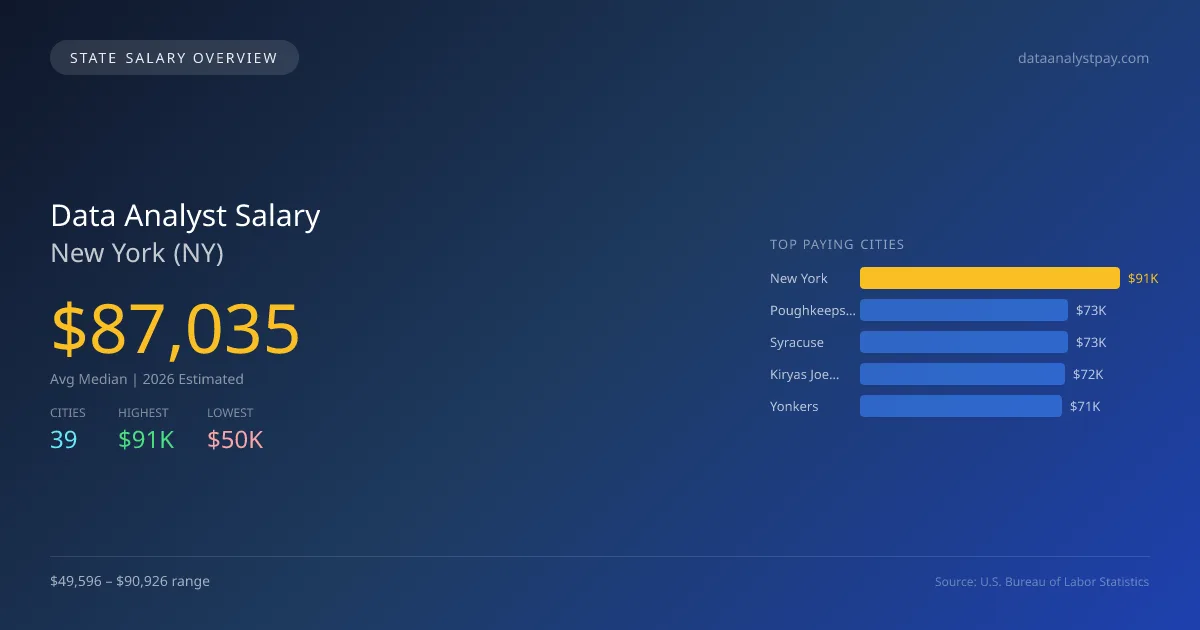
In 2026, data analyst salaries in New York are projected to average $87,035, which is 8.3% above the national median of $80,394. The highest-paying city in the state is New York City, with a salary of $90,926, while Ithaca sits at the lowest end with a salary of $49,596. This significant salary gap of $41,330 can be attributed to factors such as the concentration of tech companies and financial institutions in urban areas, driving demand for data analytics professionals. New York's job market for data analysts is anticipated to grow at an annual CAGR of 4.48%, indicating a steady demand for skilled analysts as industries increasingly rely on data-driven decision-making. It's important to note that while there are no specific state licensing requirements for data analysts, educational credentials and relevant work experience play a vital role in employment opportunities. Additionally, as businesses seek to harness data for operational efficiencies, understanding the unique market dynamics and demands in various cities will be critical for job seekers. Overall, data analysts in New York can expect a strong employment outlook, with significant variation in salaries across different metros.
New York Data Analyst Salary Range
Overall salary range in New York: $31,660 (lowest entry-level) to $144,453 (highest top earner)
New York vs National Average
New York data analysts earn 8.26% more than the national median (+$6,641/year difference).
New York Data Analyst Salary Distribution (2026)
Data Analyst salaries in New York range from $50,998 (entry-level, 10th percentile) to $138,608 (top earners, 90th percentile), with a median of $87,035. The New York median is $6,641 above the US national median of $80,394. The average hourly rate is $41.84/hr. Approximately 27,340 data analysts are employed across 39 cities.
2021 BLS Actual
$123,525
2025 BLS Actual
$83,303
2026 Current Est.
$87,035
2021–2027 Growth
+-26.4%
Salary Trajectory for Data Analysts in New York (2021–2027)
2021–2025: actual BLS OEWS data for this metro area. 2026+: CAGR 4.48% projection.
| Year | Annual Salary | Status |
|---|---|---|
| 2021 | $123,525 | Actual |
| 2022 | $125,606 | Actual |
| 2023 | $128,753 | Actual |
| 2024 | $125,804 | Actual |
| 2025 | $83,303 | Actual |
| 2026(current) | $87,035 | Estimated |
| 2027 | $90,934 | Projected |
Based on 5 years of BLS OEWS data for the New York metropolitan area, the median data analyst salary grew -32.6% from $123,525 (2021) to $83,303 (2025). At a 4.48% compound annual growth rate, salaries are projected to reach $90,934 by 2027 — a total increase of $-32,591 (-26.38%) from 2021.
Note: Historical values (2021–2025) are actual BLS OEWS figures for the New York metropolitan area, sourced from annual Occupational Employment and Wage Statistics surveys. 2026–2026 figures are current estimates, and 2027 values are projections, calculated using a 4.48% CAGR derived from 5-year BLS historical data. Actual salaries may vary based on employer, experience, certifications, and local market conditions.
Top 5 Highest Paying Cities in New York
Lowest Paying Cities in New York
Best Value Cities for Data Analysts in New York
When adjusted for local cost of living, these New York cities offer the most purchasing power for data analysts.
| City | Nominal Salary | CoL Index | Adjusted Salary |
|---|---|---|---|
| New York | $90,926 | 112.563 | $80,778 |
| Syracuse | $72,671 | 95.742 | $75,903 |
| Binghamton | $68,960 | 92.863 | $74,260 |
| Glens Falls | $69,957 | 94.866 | $73,743 |
| Buffalo | $68,372 | 95.844 | $71,337 |
Adjusted salary = nominal salary × (100 / CoL index). CoL index: 100 = national average. Lower index = lower cost of living.
Salary by Experience Level in New York
| Experience Level | Estimated Annual |
|---|---|
| Entry Level (0-2 years) | $50,998 |
| Mid Career (3-7 years) | $87,035 |
| Experienced (7+ years) | $138,608 |
Estimates based on BLS percentile data averaged across New York metro areas. Individual pay varies by employer, certifications, and specialization.
All 39 Cities in New York
| # | City | Median Salary |
|---|---|---|
| 1 | New York | $90,926 |
| 2 | Poughkeepsie | $72,860 |
| 3 | Syracuse | $72,671 |
| 4 | Kiryas Joel | $71,755 |
| 5 | Yonkers | $70,736 |
| 6 | Kingston | $70,317 |
| 7 | Newburgh | $70,196 |
| 8 | Glens Falls | $69,957 |
| 9 | New Rochelle | $69,278 |
| 10 | Binghamton | $68,960 |
| 11 | Mount Vernon | $68,502 |
| 12 | Watertown | $68,386 |
| 13 | Buffalo | $68,372 |
| 14 | Long Beach | $67,975 |
| 15 | Niagara Falls | $67,937 |
| 16 | Troy | $67,469 |
| 17 | Spring Valley | $67,210 |
| 18 | White Plains | $67,121 |
| 19 | Jamestown | $67,039 |
| 20 | Valley Stream | $66,931 |
| 21 | Middletown | $66,653 |
| 22 | Hempstead | $66,580 |
| 23 | Saratoga Springs | $66,252 |
| 24 | Albany | $66,159 |
| 25 | North Tonawanda | $65,861 |
| 26 | Auburn | $65,540 |
| 27 | Freeport | $65,352 |
| 28 | Elmira | $65,273 |
| 29 | Schenectady | $64,722 |
| 30 | Oswego | $64,674 |
| 31 | Lackawanna | $64,539 |
| 32 | Amsterdam | $64,509 |
| 33 | Oneonta | $64,353 |
| 34 | Plattsburgh | $63,689 |
| 35 | Cortland | $63,498 |
| 36 | Rochester | $62,053 |
| 37 | Utica | $52,892 |
| 38 | Rome | $52,353 |
| 39 | Ithaca | $49,596 |
More New York Salary Data
Senior / Experienced
Top earner salaries for experienced data analysts.
Compare Cities in New York
View all comparisons →Explore More Data Analyst Salary Data
Frequently Asked Questions
How much do data analysts make in New York in 2026?
What is the highest paying city for data analysts in New York?
How does New York data analyst pay compare to the national average?
What is the entry-level data analyst salary in New York?
How many data analysts are employed in New York?
Which New York city offers the best value for data analysts?
Written by Aisha Patel, MA, Certified Data Analyst
Career Analyst
Aisha has 10 years of experience in data analysis. She specializes in business intelligence and works at a tech consulting firm.
Methodology & Data Source
Statewide salary figures on this page are 2026 projections based on the Bureau of Labor Statistics Occupational Employment and Wage Statistics (OEWS) survey, May 2026 release. A 4.48% compound annual growth rate (CAGR), derived from 6-year national BLS wage trends, was applied to each metro area's reported salary to estimate current 2026 data analyst compensation across New York. State averages are employment-weighted across 39 metro areas — larger metro areas with more data analystscontribute proportionally more to the average, producing figures that better reflect typical compensation. Individual pay varies by city, employer, certifications, and experience.
Data Sources & Methodology
Source: BLS, OEWS, 5-year dataset (–). Per-city data from annual BLS metropolitan area surveys.
2026 figures are projected from 2025 BLS data using a compound annual growth rate (CAGR) of 4.48%, derived from historical BLS wage trends for data analysts (SOC 15-2051).
Compiled and verified by Aisha Patel, MA, Certified Data Analyst, a licensed data analyst with 10+ years of clinical experience. · View source data at BLS.gov