Data Analyst Salary in Oxford, MS: $42,069 (2026)
Quick Answer:A full-time data analyst in Oxford, MS earns a median $42,069/year (≈ $20.23/hour) in nominal terms for 2026 — projected from BLS OEWS 2025 (SOC 15-2051). Once you factor in Oxford's price level (14% below national, BEA RPP 85.7), that paycheck buys what $49,089 would nationally. Nominal pay sits 4.6% below the Mississippi state average.
Based on BLS state-level estimates · View source
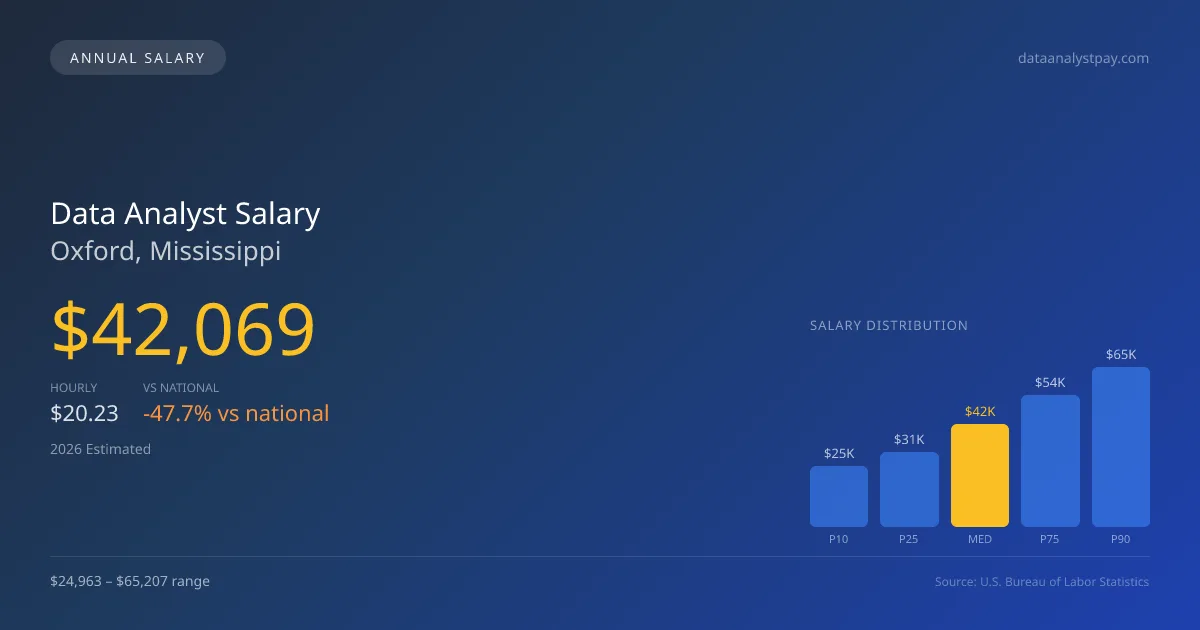
In 2026, the median annual salary for data analysts in Oxford, Mississippi is projected to be $42,069. This figure places local compensation significantly below the national median of $80,394, highlighting a disparity that reflects regional economic factors. The salary range for analysts in this area spans from $24,963 at the 10th percentile to $65,207 at the 90th percentile. These estimates are derived from 2025 BLS data, with adjustments made for regional price parity, underscoring the competitive edges and challenges within the local job market. As companies across various sectors continue to recognize the importance of data analysis, opportunities may arise that could lead to better compensation strategies in Oxford, suggesting a future upward trend.
About the Oxford Market
Salary estimated from Mississippi average ($75,000) adjusted for local cost of living.
Salary Breakdown
| Percentile | Annual | Hourly |
|---|---|---|
| Entry Level (P10) | $24,963 | $12.00 |
| Lower Range (P25) | $30,668 | $14.74 |
| Median (P50)(typical) | $42,069 | $20.23 |
| Upper Range (P75) | $53,848 | $25.89 |
| Top Earners (P90) | $65,207 | $31.35 |
Median Salary Position
47.67% below the national average
2026 Salary Percentile Distribution in Oxford
In Oxford, MS, the data analyst salary spread from the 10th to 90th percentile is $40,244 (2026 est.). At $42,069, the local median is 47.67% below the national median of $80,394.
Salary Calculator
At 40 hours/week in Oxford: You'd be in the lower-middle range
How Oxford Data Analyst Pay Compares
Oxford median: $42,069/year (2026)
| Compared To | Median Salary | Oxford Pays |
|---|---|---|
| Mississippi Average | $44,097 | -4.60% less |
| National Average | $80,394 | -47.67% less |
Data Analysts in Oxford, MS earn a median of $42,069 per year (2026 est.), which is 47.67% lower than the national median of $80,394 and 4.60% below the Mississippi state average of $44,097.
Cost-of-Living Adjusted Salary
Oxford has a cost of living 14.30% below the national average, meaning your salary goes further here.
Adjusted salary = nominal × (100 / CoL index). CoL index: 100 = national average.
Oxford, MS has a cost-of-living index of 85.7 (below the national average of 100). A data analyst earning $42,069 nominally has purchasing power equivalent to $49,089 in an average-cost city — an effective 16.69% boost.
Compare Purchasing Power
Select a city to see how your salary compares after cost of living
Select a city above to compare purchasing power
2021 BLS Actual
$33,795
2025 BLS Actual
$40,265
2026 Current Est.
$42,069
2021–2027 Growth
+30.1%
Salary Trajectory for Data Analysts in Oxford (2021–2027)
2021–2025: actual BLS OEWS data for this metro area. 2026+: CAGR 4.48% projection.
| Year | Annual Salary | Status |
|---|---|---|
| 2021 | $33,795 | Actual |
| 2022 | $34,662 | Actual |
| 2023 | $36,176 | Actual |
| 2024 | $61,322 | Actual |
| 2025 | $40,265 | Actual |
| 2026(current) | $42,069 | Estimated |
| 2027 | $43,954 | Projected |
Based on 5 years of BLS OEWS data for the Oxford metropolitan area, the median data analyst salary grew 19.1% from $33,795 (2021) to $40,265 (2025). At a 4.48% compound annual growth rate, salaries are projected to reach $43,954 by 2027 — a total increase of $10,159 (30.06%) from 2021.
Note: Historical values (2021–2025) are actual BLS OEWS figures for the Oxford metropolitan area, sourced from annual Occupational Employment and Wage Statistics surveys. 2026–2026 figures are current estimates, and 2027 values are projections, calculated using a 4.48% CAGR derived from 5-year BLS historical data. Actual salaries may vary based on employer, experience, certifications, and local market conditions.
Salary by Experience Level
| Experience | Estimated Salary Range |
|---|---|
| 0-2 years (New Graduate) | $24,963 – $30,668 |
| 3-5 years (Mid Career) | $30,668 – $42,069 |
| 5+ years (Experienced) | $42,069 – $53,848 |
| 10+ years (Top Earner) | $53,848 – $65,207 |
DA salary ranges estimated from BLS percentile data. Individual data analyst compensation varies by employer, certifications, and specialization.
Data Analyst Job Market in Oxford
In Oxford, the local job market shows a modest presence, with just five data analysts currently employed. The cost of living index for Oxford stands at 85.7, making it below the national average; this lower cost can positively influence purchasing power for analysts earning these salaries. While larger tech firms such as those in the FAANG group may not have a substantial presence locally, potential opportunities through tech startups and regional companies could offer competitive pay packages. Salary discrepancies between the lower and higher ends in the market are often driven by factors such as the tier of the employing company, with FAANG and well-funded startups typically offering more favorable compensation that includes significant equity components. Those seeking to maximize their data analyst pay in this market should consider aligning themselves with tech firms that prioritize data-driven strategies, particularly in roles that involve ML engineering or higher-level analytics, where the financial rewards can be substantially greater.
More salary data for Oxford, MS:
Frequently Asked Questions
How much do data analysts make in Oxford, MS in 2026?
Is Oxford, MS a good place to work as a data analyst?
Can data analysts make $100K in Oxford?
What is the cost-of-living adjusted data analyst salary in Oxford?
How much does a data analyst make per hour in Oxford?
Related Pages
Compare Salaries
Career Resources
Nearby Cities in Mississippi
Written by Aisha Patel, MA, Certified Data Analyst
Career Analyst
Aisha has 10 years of experience in data analysis. She specializes in business intelligence and works at a tech consulting firm.
Methodology & Data Source
Salary figures on this page are 2026 projections based on the Bureau of Labor Statistics Occupational Employment and Wage Statistics (OEWS) survey, May 2026 release. The BLS reported a median annual salary of $40,265 for data analystsin the Oxford metropolitan area. A 4.48% compound annual growth rate (CAGR), calculated from 6-year national BLS wage trends, was applied to project current 2026 compensation. Percentile ranges (P10–P90) represent the full salary distribution across experience levels and practice settings in this market.
Data Sources & Methodology
Salary data for Oxford is estimated from official BLS state-level occupational wage data (2025), adjusted for regional cost-of-living differences using BEA RPP (Regional Price Parities).
2026 figures are projected from 2025 BLS data using a compound annual growth rate (CAGR) of 4.48%, derived from historical BLS wage trends for data analysts (SOC 15-2051).
Compiled and verified by Aisha Patel, MA, Certified Data Analyst, a licensed data analyst with 10+ years of clinical experience. · View source data at BLS.gov