Data Analyst Salary in Marlborough, MA: $80,775 (2026)
Quick Answer:A full-time data analyst in Marlborough, MA earns a median $80,775/year (≈ $38.84/hour) in nominal terms for 2026 — projected from BLS OEWS 2025 (SOC 15-2051). Once you factor in Marlborough's price level (9% above national, BEA RPP 108.5), that paycheck buys what $74,447 would nationally. Nominal pay sits 1.3% below the Massachusetts state average.
Based on BLS state-level estimates · View source
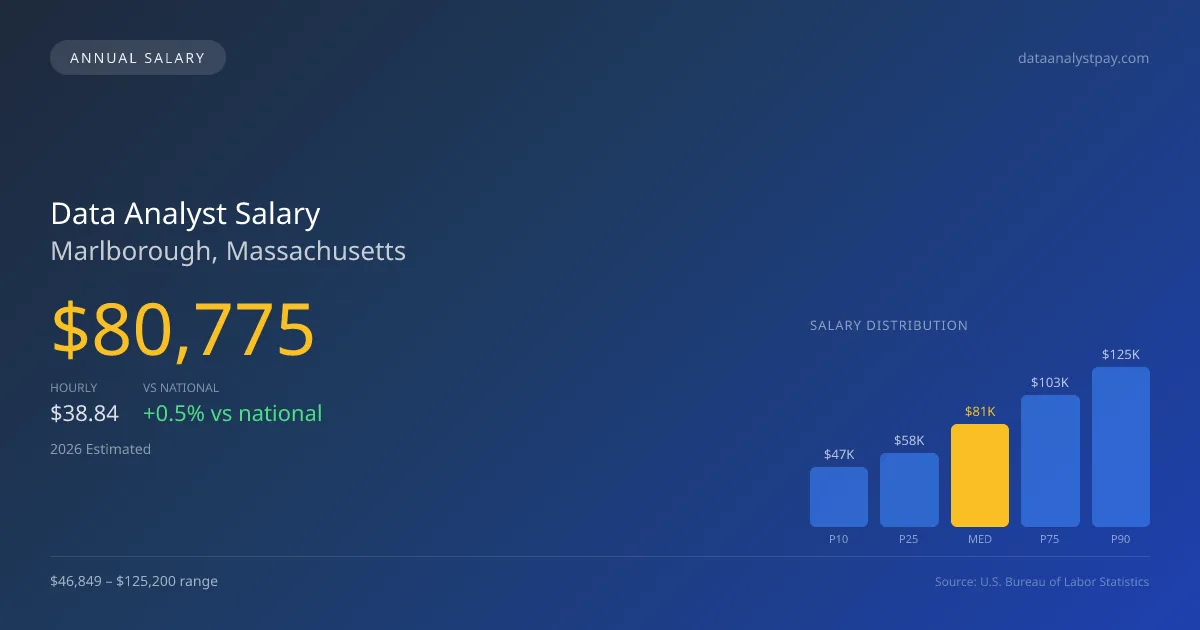
With a 2026 median annual salary of $80,775, data analysts in Marlborough, Massachusetts, enjoy a competitive compensation package that slightly exceeds the national median of $80,394. Salary ranges for these roles span from $46,849 at the 10th percentile to $125,200 at the 90th percentile, indicating a robust market for talent. These figures are derived from estimates based on 2025 BLS data and adjust for local cost-of-living considerations in Marlborough. The tech scene in the area is growing, attracting a variety of employers, including significant players in the artificial intelligence and consulting sectors, which can lead to diverse pay scales based on company type and project focus.
About the Marlborough Market
Salary estimated from Massachusetts average ($142,000) adjusted for local cost of living.
Salary Breakdown
| Percentile | Annual | Hourly |
|---|---|---|
| Entry Level (P10) | $46,849 | $22.53 |
| Lower Range (P25) | $58,158 | $27.96 |
| Median (P50)(typical) | $80,775 | $38.84 |
| Upper Range (P75) | $103,391 | $49.71 |
| Top Earners (P90) | $125,200 | $60.19 |
Median Salary Position
0.47% above the national average
2026 Salary Percentile Distribution in Marlborough
In Marlborough, MA, the data analyst salary spread from the 10th to 90th percentile is $78,351 (2026 est.). At $80,775, the local median is 0.47% above the national median of $80,394.
Salary Calculator
At 40 hours/week in Marlborough: You'd be in the lower-middle range
How Marlborough Data Analyst Pay Compares
Marlborough median: $80,775/year (2026)
| Compared To | Median Salary | Marlborough Pays |
|---|---|---|
| Massachusetts Average | $81,838 | -1.30% less |
| National Average | $80,394 | +0.47% more |
Data Analysts in Marlborough, MA earn a median of $80,775 per year (2026 est.), which is 0.47% higher than the national median of $80,394 and 1.30% below the Massachusetts state average of $81,838.
Cost-of-Living Adjusted Salary
Marlborough has a cost of living 8.50% above the national average.
Adjusted salary = nominal × (100 / CoL index). CoL index: 100 = national average.
Marlborough, MA has a cost-of-living index of 108.5 (above the national average of 100). While the nominal salary of $80,775 is competitive, the higher cost of living reduces purchasing power to an effective $74,447 — a 7.83% reduction.
Compare Purchasing Power
Select a city to see how your salary compares after cost of living
Select a city above to compare purchasing power
2021 BLS Actual
$64,888
2025 BLS Actual
$77,311
2026 Current Est.
$80,775
2021–2027 Growth
+30.1%
Salary Trajectory for Data Analysts in Marlborough (2021–2027)
2021–2025: actual BLS OEWS data for this metro area. 2026+: CAGR 4.48% projection.
| Year | Annual Salary | Status |
|---|---|---|
| 2021 | $64,888 | Actual |
| 2022 | $66,553 | Actual |
| 2023 | $69,460 | Actual |
| 2024 | $152,096 | Actual |
| 2025 | $77,311 | Actual |
| 2026(current) | $80,775 | Estimated |
| 2027 | $84,393 | Projected |
Based on 5 years of BLS OEWS data for the Marlborough metropolitan area, the median data analyst salary grew 19.1% from $64,888 (2021) to $77,311 (2025). At a 4.48% compound annual growth rate, salaries are projected to reach $84,393 by 2027 — a total increase of $19,505 (30.06%) from 2021.
Note: Historical values (2021–2025) are actual BLS OEWS figures for the Marlborough metropolitan area, sourced from annual Occupational Employment and Wage Statistics surveys. 2026–2026 figures are current estimates, and 2027 values are projections, calculated using a 4.48% CAGR derived from 5-year BLS historical data. Actual salaries may vary based on employer, experience, certifications, and local market conditions.
Salary by Experience Level
| Experience | Estimated Salary Range |
|---|---|
| 0-2 years (New Graduate) | $46,849 – $58,158 |
| 3-5 years (Mid Career) | $58,158 – $80,775 |
| 5+ years (Experienced) | $80,775 – $103,391 |
| 10+ years (Top Earner) | $103,391 – $125,200 |
DA salary ranges estimated from BLS percentile data. Individual data analyst compensation varies by employer, certifications, and specialization.
Data Analyst Job Market in Marlborough
Currently, there are 10 data analysts employed within Marlborough, emphasizing a niche but engaged market for skilled professionals in this field. The local cost of living index sits at 108.5, which means analysts must account for higher everyday expenses when evaluating take-home pay and overall earning potential. Companies across the tech spectrum drive the variation in pay, with FAANG firms and AI-focused startups typically offering more substantial compensation packages that often include generous equity components. The premium on ML engineering roles compared to traditional data analyst positions reflects the increasing specialization within the field, where PhD holders and those with advanced skills in machine learning can negotiate better salaries. To maximize earnings in this environment, candidates should consider aiming for companies known for their equity offerings and transparency in their compensation structures, such as those listed on Levels.fyi.
More salary data for Marlborough, MA:
Frequently Asked Questions
How much do data analysts make in Marlborough, MA in 2026?
Is Marlborough, MA a good place to work as a data analyst?
Can data analysts make $100K in Marlborough?
What is the cost-of-living adjusted data analyst salary in Marlborough?
How much does a data analyst make per hour in Marlborough?
Related Pages
Compare Salaries
Career Resources
Nearby Cities in Massachusetts
Written by Aisha Patel, MA, Certified Data Analyst
Career Analyst
Aisha has 10 years of experience in data analysis. She specializes in business intelligence and works at a tech consulting firm.
Methodology & Data Source
Salary figures on this page are 2026 projections based on the Bureau of Labor Statistics Occupational Employment and Wage Statistics (OEWS) survey, May 2026 release. The BLS reported a median annual salary of $77,311 for data analystsin the Marlborough metropolitan area. A 4.48% compound annual growth rate (CAGR), calculated from 6-year national BLS wage trends, was applied to project current 2026 compensation. Percentile ranges (P10–P90) represent the full salary distribution across experience levels and practice settings in this market.
Data Sources & Methodology
Salary data for Marlborough is estimated from official BLS state-level occupational wage data (2025), adjusted for regional cost-of-living differences using BEA RPP (Regional Price Parities).
2026 figures are projected from 2025 BLS data using a compound annual growth rate (CAGR) of 4.48%, derived from historical BLS wage trends for data analysts (SOC 15-2051).
Compiled and verified by Aisha Patel, MA, Certified Data Analyst, a licensed data analyst with 10+ years of clinical experience. · View source data at BLS.gov