Data Analyst Salary in Lowell, MA: $82,049 (2026)
Quick Answer:A full-time data analyst in Lowell, MA earns a median $82,049/year (≈ $39.45/hour) in nominal terms for 2026 — projected from BLS OEWS 2025 (SOC 15-2051). Once you factor in Lowell's price level (9% above national, BEA RPP 108.5), that paycheck buys what $75,621 would nationally. Nominal pay sits 0.3% above the Massachusetts state average.
Based on BLS state-level estimates · View source
In 2026, data analysts in Lowell, Massachusetts, can expect a median annual pay of $82,049, which positions them slightly above the national median of $80,394. This local salary reflects a range of compensation where entry-level analysts, earning approximately $47,589, can find opportunities to grow their earnings to as much as $127,176 at the higher end of the pay spectrum. These figures, derived from BLS state-level data and adjusted for regional cost of living, illustrate how varied the compensation landscape is. In a tech ecosystem where FAANG companies and AI-focused startups are vying for talent, the total compensation including restricted stock units (RSUs) can notably outweigh that of traditional industries in Lowell, making this market appealing for data professionals.
About the Lowell Market
Salary estimated from Massachusetts average ($142,000) adjusted for local cost of living.
Salary Breakdown
| Percentile | Annual | Hourly |
|---|---|---|
| Entry Level (P10) | $47,589 | $22.88 |
| Lower Range (P25) | $59,234 | $28.48 |
| Median (P50)(typical) | $82,049 | $39.45 |
| Upper Range (P75) | $105,023 | $50.50 |
| Top Earners (P90) | $127,176 | $61.14 |
Median Salary Position
2.06% above the national average
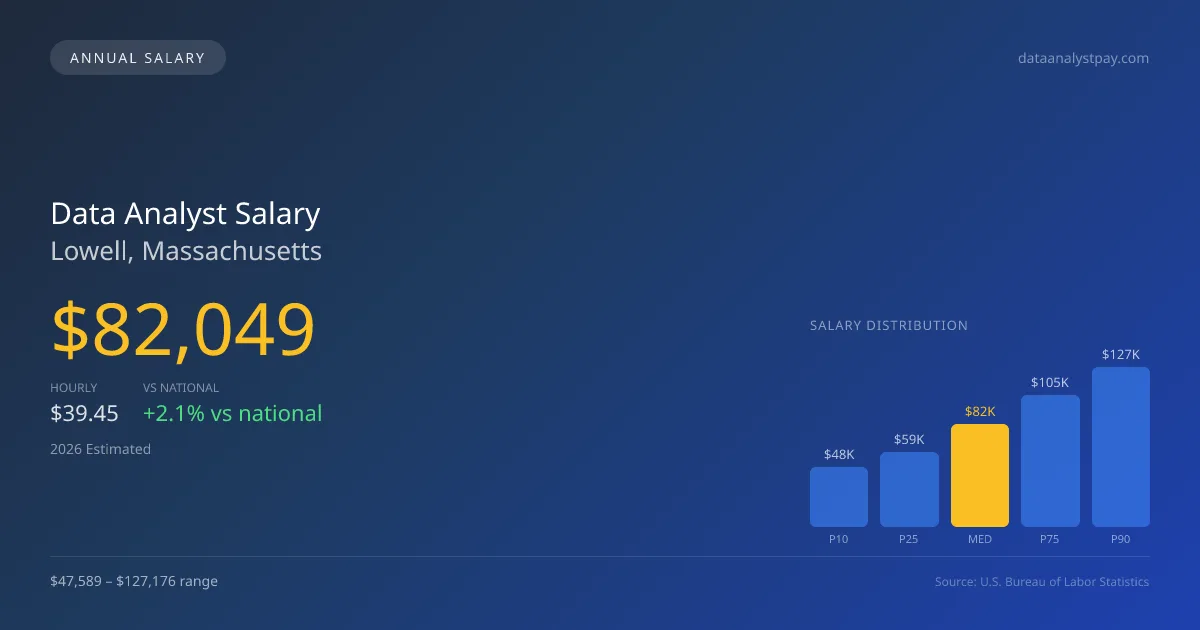
2026 Salary Percentile Distribution in Lowell
In Lowell, MA, the data analyst salary spread from the 10th to 90th percentile is $79,587 (2026 est.). At $82,049, the local median is 2.06% above the national median of $80,394.
Salary Calculator
At 40 hours/week in Lowell: You'd be in the lower-middle range
How Lowell Data Analyst Pay Compares
Lowell median: $82,049/year (2026)
| Compared To | Median Salary | Lowell Pays |
|---|---|---|
| Massachusetts Average | $81,804 | +0.30% more |
| National Average | $80,394 | +2.06% more |
Data Analysts in Lowell, MA earn a median of $82,049 per year (2026 est.), which is 2.06% higher than the national median of $80,394 and 0.30% above the Massachusetts state average of $81,804.
Cost-of-Living Adjusted Salary
Lowell has a cost of living 8.50% above the national average.
Adjusted salary = nominal × (100 / CoL index). CoL index: 100 = national average.
Lowell, MA has a cost-of-living index of 108.5 (above the national average of 100). While the nominal salary of $82,049 is competitive, the higher cost of living reduces purchasing power to an effective $75,621 — a 7.83% reduction.
Compare Purchasing Power
Select a city to see how your salary compares after cost of living
Select a city above to compare purchasing power
2021 BLS Actual
$65,912
2025 BLS Actual
$78,531
2026 Current Est.
$82,049
2021–2027 Growth
+30.1%
Salary Trajectory for Data Analysts in Lowell (2021–2027)
2021–2025: actual BLS OEWS data for this metro area. 2026+: CAGR 4.48% projection.
| Year | Annual Salary | Status |
|---|---|---|
| 2021 | $65,912 | Actual |
| 2022 | $67,603 | Actual |
| 2023 | $70,556 | Actual |
| 2024 | $154,497 | Actual |
| 2025 | $78,531 | Actual |
| 2026(current) | $82,049 | Estimated |
| 2027 | $85,725 | Projected |
Based on 5 years of BLS OEWS data for the Lowell metropolitan area, the median data analyst salary grew 19.1% from $65,912 (2021) to $78,531 (2025). At a 4.48% compound annual growth rate, salaries are projected to reach $85,725 by 2027 — a total increase of $19,813 (30.06%) from 2021.
Note: Historical values (2021–2025) are actual BLS OEWS figures for the Lowell metropolitan area, sourced from annual Occupational Employment and Wage Statistics surveys. 2026–2026 figures are current estimates, and 2027 values are projections, calculated using a 4.48% CAGR derived from 5-year BLS historical data. Actual salaries may vary based on employer, experience, certifications, and local market conditions.
Salary by Experience Level
| Experience | Estimated Salary Range |
|---|---|
| 0-2 years (New Graduate) | $47,589 – $59,234 |
| 3-5 years (Mid Career) | $59,234 – $82,049 |
| 5+ years (Experienced) | $82,049 – $105,023 |
| 10+ years (Top Earner) | $105,023 – $127,176 |
DA salary ranges estimated from BLS percentile data. Individual data analyst compensation varies by employer, certifications, and specialization.
Data Analyst Job Market in Lowell
The local job market for data analysts in Lowell features about 29 professionals, indicating a solid yet niche community for this role. The cost of living index stands at 108.5, above the national average, which can impact take-home pay and purchasing power in the area. Companies like Google and Amazon, along with emerging AI-focused startups, often lead in compensation, weighted heavily by equity and bonuses, particularly for those in advanced positions. This variance in salaries can be attributed to several factors: the prestige of the employer, the level within the organization, and the balance of base pay against RSUs, which can constitute a considerable part of an analyst's total compensation. Analysts with specialized skills in machine learning may find more lucrative positions compared to those focused on traditional analytics. To maximize earnings in Lowell, it's advisable to target roles at top-tier companies and negotiate for equity and signing bonuses, particularly for candidates with advanced degrees or relevant experience in high-demand areas.
More salary data for Lowell, MA:
Frequently Asked Questions
How much do data analysts make in Lowell, MA in 2026?
Is Lowell, MA a good place to work as a data analyst?
Can data analysts make $100K in Lowell?
What is the cost-of-living adjusted data analyst salary in Lowell?
How much does a data analyst make per hour in Lowell?
Related Pages
Compare Salaries
Career Resources
Nearby Cities in Massachusetts
Written by Aisha Patel, MA, Certified Data Analyst
Career Analyst
Aisha has 10 years of experience in data analysis. She specializes in business intelligence and works at a tech consulting firm.
Methodology & Data Source
Salary figures on this page are 2026 projections based on the Bureau of Labor Statistics Occupational Employment and Wage Statistics (OEWS) survey, May 2026 release. The BLS reported a median annual salary of $78,531 for data analystsin the Lowell metropolitan area. A 4.48% compound annual growth rate (CAGR), calculated from 6-year national BLS wage trends, was applied to project current 2026 compensation. Percentile ranges (P10–P90) represent the full salary distribution across experience levels and practice settings in this market.
Data Sources & Methodology
Salary data for Lowell is estimated from official BLS state-level occupational wage data (2025), adjusted for regional cost-of-living differences using BEA RPP (Regional Price Parities).
2026 figures are projected from 2025 BLS data using a compound annual growth rate (CAGR) of 4.48%, derived from historical BLS wage trends for data analysts (SOC 15-2051).
Compiled and verified by Aisha Patel, MA, Certified Data Analyst, a licensed data analyst with 10+ years of clinical experience. · View source data at BLS.gov