Data Analyst Salary in Framingham, MA: $82,012 (2026)
Quick Answer:A full-time data analyst in Framingham, MA earns a median $82,012/year (≈ $39.43/hour) in nominal terms for 2026 — projected from BLS OEWS 2025 (SOC 15-2051). Once you factor in Framingham's price level (9% above national, BEA RPP 108.5), that paycheck buys what $75,587 would nationally. Nominal pay sits 0.2% above the Massachusetts state average.
Based on BLS state-level estimates · View source
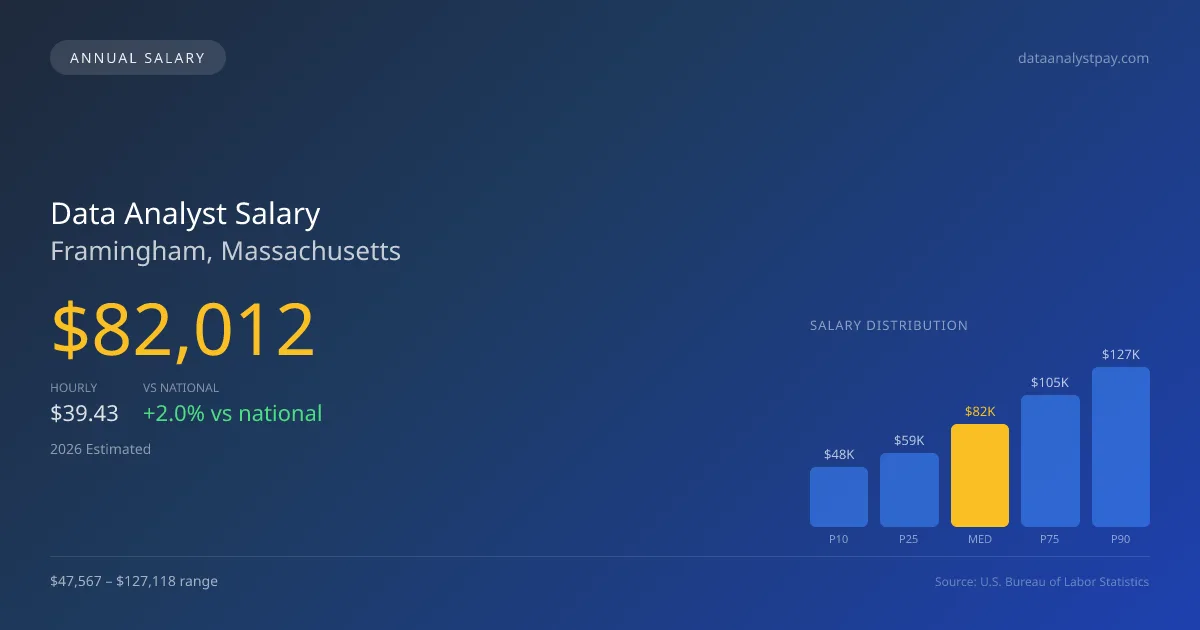
In Framingham, Massachusetts, the projected median annual salary for data analysts in 2026 stands at $82,012, reflecting a strong local market that exceeds the national median of $80,394 by 2.01%. Salary ranges vary significantly, from a low of $47,567 to a high of $127,118, illustrating the diverse opportunities available based on experience and skill sets. This data is derived from BLS state-level statistics and adjusted for regional cost of living. As companies in Framingham, particularly those within the tech sector, continue to grow, data analysts with specialized skills in machine learning engineering can expect to command higher salaries compared to those focusing more on research or product data science.
About the Framingham Market
Salary estimated from Massachusetts average ($142,000) adjusted for local cost of living.
Salary Breakdown
| Percentile | Annual | Hourly |
|---|---|---|
| Entry Level (P10) | $47,567 | $22.87 |
| Lower Range (P25) | $59,048 | $28.39 |
| Median (P50)(typical) | $82,012 | $39.43 |
| Upper Range (P75) | $104,975 | $50.46 |
| Top Earners (P90) | $127,118 | $61.11 |
Median Salary Position
2.01% above the national average
2026 Salary Percentile Distribution in Framingham
In Framingham, MA, the data analyst salary spread from the 10th to 90th percentile is $79,551 (2026 est.). At $82,012, the local median is 2.01% above the national median of $80,394.
Salary Calculator
At 40 hours/week in Framingham: You'd be in the lower-middle range
How Framingham Data Analyst Pay Compares
Framingham median: $82,012/year (2026)
| Compared To | Median Salary | Framingham Pays |
|---|---|---|
| Massachusetts Average | $81,848 | +0.20% more |
| National Average | $80,394 | +2.01% more |
Data Analysts in Framingham, MA earn a median of $82,012 per year (2026 est.), which is 2.01% higher than the national median of $80,394 and 0.20% above the Massachusetts state average of $81,848.
Cost-of-Living Adjusted Salary
Framingham has a cost of living 8.50% above the national average.
Adjusted salary = nominal × (100 / CoL index). CoL index: 100 = national average.
Framingham, MA has a cost-of-living index of 108.5 (above the national average of 100). While the nominal salary of $82,012 is competitive, the higher cost of living reduces purchasing power to an effective $75,587 — a 7.83% reduction.
Compare Purchasing Power
Select a city to see how your salary compares after cost of living
Select a city above to compare purchasing power
2021 BLS Actual
$65,881
2025 BLS Actual
$78,495
2026 Current Est.
$82,012
2021–2027 Growth
+30.1%
Salary Trajectory for Data Analysts in Framingham (2021–2027)
2021–2025: actual BLS OEWS data for this metro area. 2026+: CAGR 4.48% projection.
| Year | Annual Salary | Status |
|---|---|---|
| 2021 | $65,881 | Actual |
| 2022 | $67,572 | Actual |
| 2023 | $70,523 | Actual |
| 2024 | $154,427 | Actual |
| 2025 | $78,495 | Actual |
| 2026(current) | $82,012 | Estimated |
| 2027 | $85,686 | Projected |
Based on 5 years of BLS OEWS data for the Framingham metropolitan area, the median data analyst salary grew 19.1% from $65,881 (2021) to $78,495 (2025). At a 4.48% compound annual growth rate, salaries are projected to reach $85,686 by 2027 — a total increase of $19,805 (30.06%) from 2021.
Note: Historical values (2021–2025) are actual BLS OEWS figures for the Framingham metropolitan area, sourced from annual Occupational Employment and Wage Statistics surveys. 2026–2026 figures are current estimates, and 2027 values are projections, calculated using a 4.48% CAGR derived from 5-year BLS historical data. Actual salaries may vary based on employer, experience, certifications, and local market conditions.
Salary by Experience Level
| Experience | Estimated Salary Range |
|---|---|
| 0-2 years (New Graduate) | $47,567 – $59,048 |
| 3-5 years (Mid Career) | $59,048 – $82,012 |
| 5+ years (Experienced) | $82,012 – $104,975 |
| 10+ years (Top Earner) | $104,975 – $127,118 |
DA salary ranges estimated from BLS percentile data. Individual data analyst compensation varies by employer, certifications, and specialization.
Data Analyst Job Market in Framingham
The job market for data analysts in Framingham is relatively small, with only 17 professionals currently employed in the field. However, the local cost-of-living index at 108.5 indicates that living expenses are above the national average, which impacts take-home salaries. High-paying employers often include FAANG companies that can offer considerable total compensation packages for analyst positions, sometimes exceeding basic salary expectations through substantial equity offerings and signing bonuses. The variation in pay underscores the importance of specialty areas, with ML engineering roles typically commanding higher compensation than traditional data analysis positions. For those seeking to maximize their earning potential, aligning one's expertise with high-demand skills, pursuing positions within top-tier tech firms, and considering roles that offer equity in addition to a competitive salary are recommended strategies in the Framingham market.
More salary data for Framingham, MA:
Frequently Asked Questions
How much do data analysts make in Framingham, MA in 2026?
Is Framingham, MA a good place to work as a data analyst?
Can data analysts make $100K in Framingham?
What is the cost-of-living adjusted data analyst salary in Framingham?
How much does a data analyst make per hour in Framingham?
Related Pages
Compare Salaries
Career Resources
Nearby Cities in Massachusetts
Written by Aisha Patel, MA, Certified Data Analyst
Career Analyst
Aisha has 10 years of experience in data analysis. She specializes in business intelligence and works at a tech consulting firm.
Methodology & Data Source
Salary figures on this page are 2026 projections based on the Bureau of Labor Statistics Occupational Employment and Wage Statistics (OEWS) survey, May 2026 release. The BLS reported a median annual salary of $78,495 for data analystsin the Framingham metropolitan area. A 4.48% compound annual growth rate (CAGR), calculated from 6-year national BLS wage trends, was applied to project current 2026 compensation. Percentile ranges (P10–P90) represent the full salary distribution across experience levels and practice settings in this market.
Data Sources & Methodology
Salary data for Framingham is estimated from official BLS state-level occupational wage data (2025), adjusted for regional cost-of-living differences using BEA RPP (Regional Price Parities).
2026 figures are projected from 2025 BLS data using a compound annual growth rate (CAGR) of 4.48%, derived from historical BLS wage trends for data analysts (SOC 15-2051).
Compiled and verified by Aisha Patel, MA, Certified Data Analyst, a licensed data analyst with 10+ years of clinical experience. · View source data at BLS.gov