Data Analyst Salary in Glen Burnie, MD: $55,788 (2026)
Quick Answer:A full-time data analyst in Glen Burnie, MD earns a median $55,788/year (≈ $26.82/hour) in nominal terms for 2026 — projected from BLS OEWS 2025 (SOC 15-2051). Once you factor in Glen Burnie's price level (9% above national, BEA RPP 109.3), that paycheck buys what $51,041 would nationally. Nominal pay sits 0.8% below the Maryland state average.
Based on BLS state-level estimates · View source
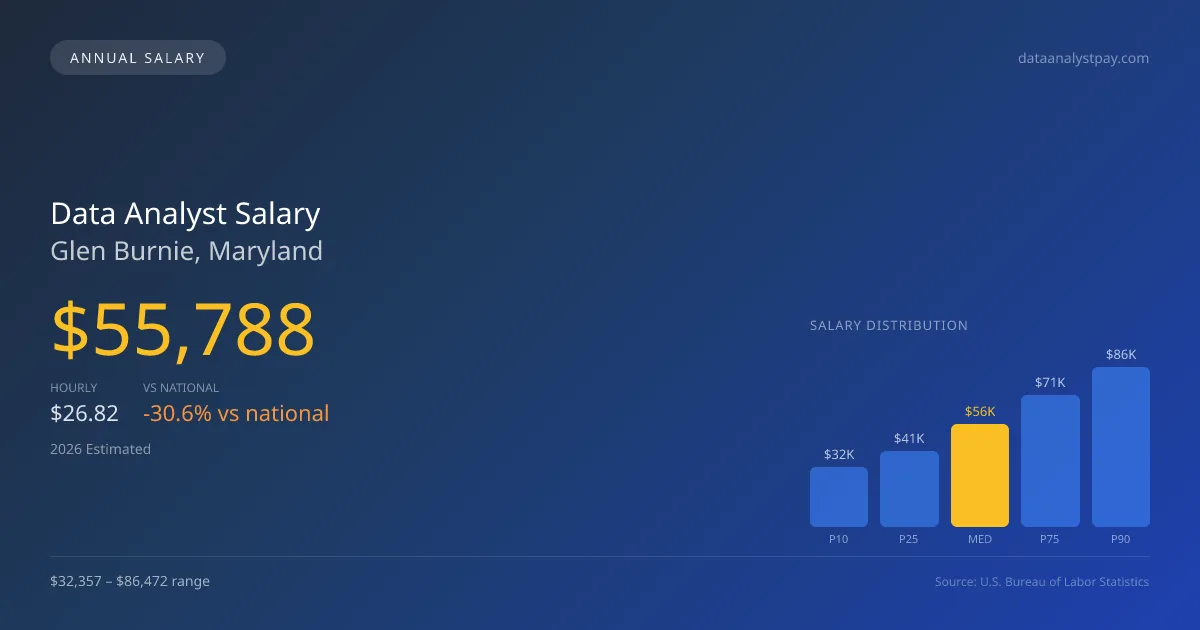
In 2026, the data analyst salary in Glen Burnie, MD is projected to reach a median of $55,788, markedly lower than the national median of $80,394. Located within an increasing wage growth environment, the pay range for data analysts in Glen Burnie reflects substantial variability, spanning from $32,357 at the 10th percentile to $86,472 at the 90th percentile. This notable range indicates a healthy market presence for data analytics roles, influenced by the specific expertise required, as ML engineering positions often command higher pay than their analytics or product data science counterparts. The figures discussed stem from local estimates based on 2025 BLS data, adjusted for regional economic conditions, showcasing the unique salary dynamics within Glen Burnie's job marketplace.
About the Glen Burnie Market
Salary estimated from Maryland average ($128,000) adjusted for local cost of living.
Salary Breakdown
| Percentile | Annual | Hourly |
|---|---|---|
| Entry Level (P10) | $32,357 | $15.56 |
| Lower Range (P25) | $41,293 | $19.85 |
| Median (P50)(typical) | $55,788 | $26.82 |
| Upper Range (P75) | $71,409 | $34.33 |
| Top Earners (P90) | $86,472 | $41.57 |
Median Salary Position
30.61% below the national average
2026 Salary Percentile Distribution in Glen Burnie
In Glen Burnie, MD, the data analyst salary spread from the 10th to 90th percentile is $54,115 (2026 est.). At $55,788, the local median is 30.61% below the national median of $80,394.
Salary Calculator
At 40 hours/week in Glen Burnie: You'd be in the lower-middle range
How Glen Burnie Data Analyst Pay Compares
Glen Burnie median: $55,788/year (2026)
| Compared To | Median Salary | Glen Burnie Pays |
|---|---|---|
| Maryland Average | $56,238 | -0.80% less |
| National Average | $80,394 | -30.61% less |
Data Analysts in Glen Burnie, MD earn a median of $55,788 per year (2026 est.), which is 30.61% lower than the national median of $80,394 and 0.80% below the Maryland state average of $56,238.
Cost-of-Living Adjusted Salary
Glen Burnie has a cost of living 9.30% above the national average.
Adjusted salary = nominal × (100 / CoL index). CoL index: 100 = national average.
Glen Burnie, MD has a cost-of-living index of 109.3 (above the national average of 100). While the nominal salary of $55,788 is competitive, the higher cost of living reduces purchasing power to an effective $51,041 — a 8.51% reduction.
Compare Purchasing Power
Select a city to see how your salary compares after cost of living
Select a city above to compare purchasing power
2021 BLS Actual
$44,816
2025 BLS Actual
$53,396
2026 Current Est.
$55,788
2021–2027 Growth
+30.1%
Salary Trajectory for Data Analysts in Glen Burnie (2021–2027)
2021–2025: actual BLS OEWS data for this metro area. 2026+: CAGR 4.48% projection.
| Year | Annual Salary | Status |
|---|---|---|
| 2021 | $44,816 | Actual |
| 2022 | $45,966 | Actual |
| 2023 | $47,973 | Actual |
| 2024 | $138,788 | Actual |
| 2025 | $53,396 | Actual |
| 2026(current) | $55,788 | Estimated |
| 2027 | $58,287 | Projected |
Based on 5 years of BLS OEWS data for the Glen Burnie metropolitan area, the median data analyst salary grew 19.1% from $44,816 (2021) to $53,396 (2025). At a 4.48% compound annual growth rate, salaries are projected to reach $58,287 by 2027 — a total increase of $13,471 (30.06%) from 2021.
Note: Historical values (2021–2025) are actual BLS OEWS figures for the Glen Burnie metropolitan area, sourced from annual Occupational Employment and Wage Statistics surveys. 2026–2026 figures are current estimates, and 2027 values are projections, calculated using a 4.48% CAGR derived from 5-year BLS historical data. Actual salaries may vary based on employer, experience, certifications, and local market conditions.
Salary by Experience Level
| Experience | Estimated Salary Range |
|---|---|
| 0-2 years (New Graduate) | $32,357 – $41,293 |
| 3-5 years (Mid Career) | $41,293 – $55,788 |
| 5+ years (Experienced) | $55,788 – $71,409 |
| 10+ years (Top Earner) | $71,409 – $86,472 |
DA salary ranges estimated from BLS percentile data. Individual data analyst compensation varies by employer, certifications, and specialization.
Data Analyst Job Market in Glen Burnie
The local job market for data analysts remains relatively small, with only 14 professionals currently employed in the Glen Burnie area. The cost of living index sits at 109.3, which exceeds the national average and can impact the practical value of salaries. Employers such as FAANG companies and AI-driven startups often provide the most lucrative compensation packages, blending base salary, equity, and bonuses to attract top-tier talent. The distinction in salaries is primarily driven by company type, level of experience, and specialty focus. For analysts in Glen Burnie, pursuing roles that favor machine learning engineering can unlock better financial opportunities. Staying informed on compensation structures through platforms like Levels.fyi can help candidates negotiate effectively for higher salaries, particularly if they possess advanced degrees or specialized skills relevant to the industry demands.
More salary data for Glen Burnie, MD:
Frequently Asked Questions
How much do data analysts make in Glen Burnie, MD in 2026?
Is Glen Burnie, MD a good place to work as a data analyst?
Can data analysts make $100K in Glen Burnie?
What is the cost-of-living adjusted data analyst salary in Glen Burnie?
How much does a data analyst make per hour in Glen Burnie?
Related Pages
Compare Salaries
Career Resources
Nearby Cities in Maryland
Written by Aisha Patel, MA, Certified Data Analyst
Career Analyst
Aisha has 10 years of experience in data analysis. She specializes in business intelligence and works at a tech consulting firm.
Methodology & Data Source
Salary figures on this page are 2026 projections based on the Bureau of Labor Statistics Occupational Employment and Wage Statistics (OEWS) survey, May 2026 release. The BLS reported a median annual salary of $53,396 for data analystsin the Glen Burnie metropolitan area. A 4.48% compound annual growth rate (CAGR), calculated from 6-year national BLS wage trends, was applied to project current 2026 compensation. Percentile ranges (P10–P90) represent the full salary distribution across experience levels and practice settings in this market.
Data Sources & Methodology
Salary data for Glen Burnie is estimated from official BLS state-level occupational wage data (2025), adjusted for regional cost-of-living differences using BEA RPP (Regional Price Parities).
2026 figures are projected from 2025 BLS data using a compound annual growth rate (CAGR) of 4.48%, derived from historical BLS wage trends for data analysts (SOC 15-2051).
Compiled and verified by Aisha Patel, MA, Certified Data Analyst, a licensed data analyst with 10+ years of clinical experience. · View source data at BLS.gov