Data Analyst Salary in Gardner, KS: $43,372 (2026)
Quick Answer:A full-time data analyst in Gardner, KS earns a median $43,372/year (≈ $20.85/hour) in nominal terms for 2026 — projected from BLS OEWS 2025 (SOC 15-2051). Once you factor in Gardner's price level (9% below national, BEA RPP 90.9), that paycheck buys what $47,714 would nationally. Nominal pay sits 7.3% below the Kansas state average.
Based on BLS state-level estimates · View source
In Gardner, Kansas, the projected data analyst salary in 2026 is set at $43,372, representing a significant gap compared to the national median of $80,394. This disparity is pronounced when examining the local salary range that spans from $26,823 at the 10th percentile to $67,227 at the 90th percentile. These figures, sourced from 2025 BLS data and adjusted for regional factors, reflect the stark differences in compensation based on company type. While large tech firms affiliated with FAANG may offer substantially higher total compensation packages that include significant RSU allocations, roles in traditional industries are more modestly compensated. Consequently, job seekers in Gardner must strategically evaluate potential employers to maximize their earning potential in this competitive market.
About the Gardner Market
Salary estimated from Kansas average ($92,000) adjusted for local cost of living.
Salary Breakdown
| Percentile | Annual | Hourly |
|---|---|---|
| Entry Level (P10) | $26,823 | $12.89 |
| Lower Range (P25) | $32,278 | $15.52 |
| Median (P50)(typical) | $43,372 | $20.85 |
| Upper Range (P75) | $55,515 | $26.69 |
| Top Earners (P90) | $67,227 | $32.32 |
Median Salary Position
46.05% below the national average
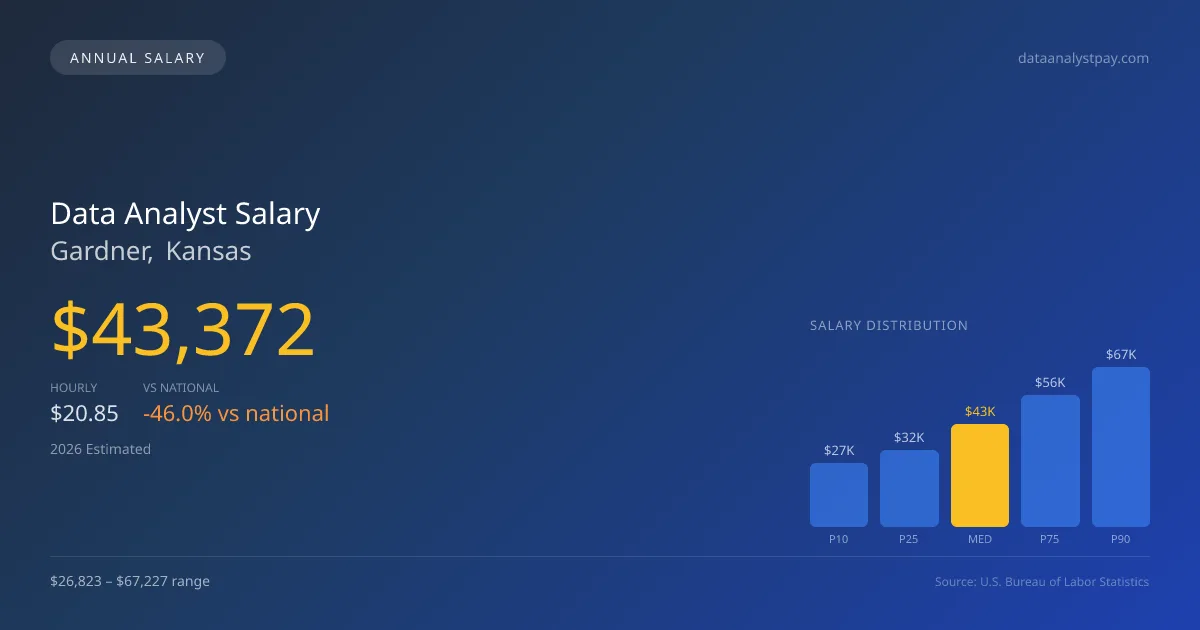
2026 Salary Percentile Distribution in Gardner
In Gardner, KS, the data analyst salary spread from the 10th to 90th percentile is $40,404 (2026 est.). At $43,372, the local median is 46.05% below the national median of $80,394.
Salary Calculator
At 40 hours/week in Gardner: You'd be in the lower-middle range
How Gardner Data Analyst Pay Compares
Gardner median: $43,372/year (2026)
| Compared To | Median Salary | Gardner Pays |
|---|---|---|
| Kansas Average | $46,787 | -7.30% less |
| National Average | $80,394 | -46.05% less |
Data Analysts in Gardner, KS earn a median of $43,372 per year (2026 est.), which is 46.05% lower than the national median of $80,394 and 7.30% below the Kansas state average of $46,787.
Cost-of-Living Adjusted Salary
Gardner has a cost of living 9.10% below the national average, meaning your salary goes further here.
Adjusted salary = nominal × (100 / CoL index). CoL index: 100 = national average.
Gardner, KS has a cost-of-living index of 90.9 (below the national average of 100). A data analyst earning $43,372 nominally has purchasing power equivalent to $47,714 in an average-cost city — an effective 10.01% boost.
Compare Purchasing Power
Select a city to see how your salary compares after cost of living
Select a city above to compare purchasing power
2021 BLS Actual
$34,841
2025 BLS Actual
$41,512
2026 Current Est.
$43,372
2021–2027 Growth
+30.1%
Salary Trajectory for Data Analysts in Gardner (2021–2027)
2021–2025: actual BLS OEWS data for this metro area. 2026+: CAGR 4.48% projection.
| Year | Annual Salary | Status |
|---|---|---|
| 2021 | $34,841 | Actual |
| 2022 | $35,736 | Actual |
| 2023 | $37,296 | Actual |
| 2024 | $77,551 | Actual |
| 2025 | $41,512 | Actual |
| 2026(current) | $43,372 | Estimated |
| 2027 | $45,315 | Projected |
Based on 5 years of BLS OEWS data for the Gardner metropolitan area, the median data analyst salary grew 19.1% from $34,841 (2021) to $41,512 (2025). At a 4.48% compound annual growth rate, salaries are projected to reach $45,315 by 2027 — a total increase of $10,474 (30.06%) from 2021.
Note: Historical values (2021–2025) are actual BLS OEWS figures for the Gardner metropolitan area, sourced from annual Occupational Employment and Wage Statistics surveys. 2026–2026 figures are current estimates, and 2027 values are projections, calculated using a 4.48% CAGR derived from 5-year BLS historical data. Actual salaries may vary based on employer, experience, certifications, and local market conditions.
Salary by Experience Level
| Experience | Estimated Salary Range |
|---|---|
| 0-2 years (New Graduate) | $26,823 – $32,278 |
| 3-5 years (Mid Career) | $32,278 – $43,372 |
| 5+ years (Experienced) | $43,372 – $55,515 |
| 10+ years (Top Earner) | $55,515 – $67,227 |
DA salary ranges estimated from BLS percentile data. Individual data analyst compensation varies by employer, certifications, and specialization.
Data Analyst Job Market in Gardner
The local job market for data analysts in Gardner currently employs six professionals, a modest number that indicates a limited but potentially growing field. With a cost of living index at 90.9, residents enjoy a slightly lower living expense compared to the national average, impacting their overall purchasing power. Firms on the higher end of the pay spectrum are likely those who can offer equity-heavy compensation structures typically found in AI-focused startups or mid-tier tech companies rather than local businesses. The spread in salaries is influenced by the nature of the company—those affiliated with FAANG or cutting-edge tech startups tend to compensate at much higher levels than traditional employers. For those considering a career in data analysis in Gardner, honing specialized skills in machine learning engineering or securing positions with leading tech firms can provide pathways to negotiate better pay, particularly for candidates with advanced degrees who can leverage RSU opportunities for long-term financial growth.
More salary data for Gardner, KS:
Frequently Asked Questions
How much do data analysts make in Gardner, KS in 2026?
Is Gardner, KS a good place to work as a data analyst?
Can data analysts make $100K in Gardner?
What is the cost-of-living adjusted data analyst salary in Gardner?
How much does a data analyst make per hour in Gardner?
Related Pages
Compare Salaries
Career Resources
Nearby Cities in Kansas
Written by Aisha Patel, MA, Certified Data Analyst
Career Analyst
Aisha has 10 years of experience in data analysis. She specializes in business intelligence and works at a tech consulting firm.
Methodology & Data Source
Salary figures on this page are 2026 projections based on the Bureau of Labor Statistics Occupational Employment and Wage Statistics (OEWS) survey, May 2026 release. The BLS reported a median annual salary of $41,512 for data analystsin the Gardner metropolitan area. A 4.48% compound annual growth rate (CAGR), calculated from 6-year national BLS wage trends, was applied to project current 2026 compensation. Percentile ranges (P10–P90) represent the full salary distribution across experience levels and practice settings in this market.
Data Sources & Methodology
Salary data for Gardner is estimated from official BLS state-level occupational wage data (2025), adjusted for regional cost-of-living differences using BEA RPP (Regional Price Parities).
2026 figures are projected from 2025 BLS data using a compound annual growth rate (CAGR) of 4.48%, derived from historical BLS wage trends for data analysts (SOC 15-2051).
Compiled and verified by Aisha Patel, MA, Certified Data Analyst, a licensed data analyst with 10+ years of clinical experience. · View source data at BLS.gov