Data Analyst Salary in Granger, IN: $52,959 (2026)
Quick Answer:A full-time data analyst in Granger, IN earns a median $52,959/year (≈ $25.46/hour) in nominal terms for 2026 — projected from BLS OEWS 2025 (SOC 15-2051). Once you factor in Granger's price level (9% below national, BEA RPP 91.3), that paycheck buys what $58,005 would nationally. Nominal pay sits 4.1% below the Indiana state average.
Based on BLS state-level estimates · View source
In Granger, Indiana, the projected median annual salary for data analysts in 2026 is $52,959, a figure that starkly contrasts with the national median of $80,394. This disparity creates a notable gap, influenced heavily by the local job market's composition. While the salary range for local analysts extends from $31,922 at the 10th percentile to $82,086 at the 90th percentile, many data analysts may find themselves at the lower end of this spectrum. This can be attributed to the town's limited presence of large tech companies and emerging firms, which typically offer robust total compensation packages that include stock options and bonuses to remain competitive, especially in FAANG-centric markets.
About the Granger Market
Salary estimated from Indiana average ($95,000) adjusted for local cost of living.
Salary Breakdown
| Percentile | Annual | Hourly |
|---|---|---|
| Entry Level (P10) | $31,922 | $15.35 |
| Lower Range (P25) | $38,932 | $18.71 |
| Median (P50)(typical) | $52,959 | $25.46 |
| Upper Range (P75) | $67,788 | $32.59 |
| Top Earners (P90) | $82,086 | $39.46 |
Median Salary Position
34.13% below the national average
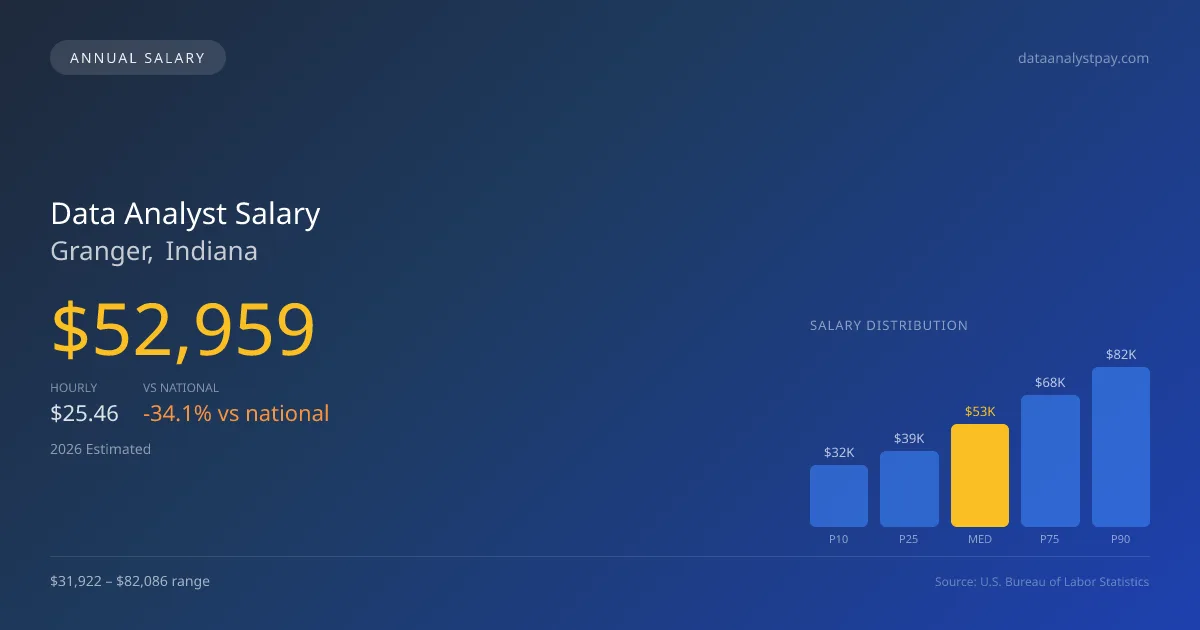
2026 Salary Percentile Distribution in Granger
In Granger, IN, the data analyst salary spread from the 10th to 90th percentile is $50,164 (2026 est.). At $52,959, the local median is 34.13% below the national median of $80,394.
Salary Calculator
At 40 hours/week in Granger: You'd be in the lower-middle range
How Granger Data Analyst Pay Compares
Granger median: $52,959/year (2026)
| Compared To | Median Salary | Granger Pays |
|---|---|---|
| Indiana Average | $55,223 | -4.10% less |
| National Average | $80,394 | -34.13% less |
Data Analysts in Granger, IN earn a median of $52,959 per year (2026 est.), which is 34.13% lower than the national median of $80,394 and 4.10% below the Indiana state average of $55,223.
Cost-of-Living Adjusted Salary
Granger has a cost of living 8.70% below the national average, meaning your salary goes further here.
Adjusted salary = nominal × (100 / CoL index). CoL index: 100 = national average.
Granger, IN has a cost-of-living index of 91.3 (below the national average of 100). A data analyst earning $52,959 nominally has purchasing power equivalent to $58,005 in an average-cost city — an effective 9.53% boost.
Compare Purchasing Power
Select a city to see how your salary compares after cost of living
Select a city above to compare purchasing power
2021 BLS Actual
$42,543
2025 BLS Actual
$50,688
2026 Current Est.
$52,959
2021–2027 Growth
+30.1%
Salary Trajectory for Data Analysts in Granger (2021–2027)
2021–2025: actual BLS OEWS data for this metro area. 2026+: CAGR 4.48% projection.
| Year | Annual Salary | Status |
|---|---|---|
| 2021 | $42,543 | Actual |
| 2022 | $43,635 | Actual |
| 2023 | $45,540 | Actual |
| 2024 | $83,174 | Actual |
| 2025 | $50,688 | Actual |
| 2026(current) | $52,959 | Estimated |
| 2027 | $55,331 | Projected |
Based on 5 years of BLS OEWS data for the Granger metropolitan area, the median data analyst salary grew 19.1% from $42,543 (2021) to $50,688 (2025). At a 4.48% compound annual growth rate, salaries are projected to reach $55,331 by 2027 — a total increase of $12,788 (30.06%) from 2021.
Note: Historical values (2021–2025) are actual BLS OEWS figures for the Granger metropolitan area, sourced from annual Occupational Employment and Wage Statistics surveys. 2026–2026 figures are current estimates, and 2027 values are projections, calculated using a 4.48% CAGR derived from 5-year BLS historical data. Actual salaries may vary based on employer, experience, certifications, and local market conditions.
Salary by Experience Level
| Experience | Estimated Salary Range |
|---|---|
| 0-2 years (New Graduate) | $31,922 – $38,932 |
| 3-5 years (Mid Career) | $38,932 – $52,959 |
| 5+ years (Experienced) | $52,959 – $67,788 |
| 10+ years (Top Earner) | $67,788 – $82,086 |
DA salary ranges estimated from BLS percentile data. Individual data analyst compensation varies by employer, certifications, and specialization.
Data Analyst Job Market in Granger
The employment outlook for data analysts in Granger remains stable, albeit with a modest workforce of just seven professionals actively employed in this field. The cost of living in the area, quantified by an index of 91.3, is below the national average, meaning that take-home pay can stretch further, providing some relief to local analysts. However, for those seeking higher compensation, targeting employment at larger firms like healthcare AI or national consulting companies may offer more lucrative options compared to traditional industries. Pay disparities largely stem from the nature of the employer and the structure of compensation packages—FAANG firms frequently provide equity and RSUs that significantly amplify total earnings. To maximize potential salaries, analysts in Granger should focus on developing specialized skills in machine learning and analytics, as well as considering remote opportunities with companies willing to pay competitive rates reflective of national standards.
More salary data for Granger, IN:
Frequently Asked Questions
How much do data analysts make in Granger, IN in 2026?
Is Granger, IN a good place to work as a data analyst?
Can data analysts make $100K in Granger?
What is the cost-of-living adjusted data analyst salary in Granger?
How much does a data analyst make per hour in Granger?
Related Pages
Compare Salaries
Career Resources
Nearby Cities in Indiana
Written by Aisha Patel, MA, Certified Data Analyst
Career Analyst
Aisha has 10 years of experience in data analysis. She specializes in business intelligence and works at a tech consulting firm.
Methodology & Data Source
Salary figures on this page are 2026 projections based on the Bureau of Labor Statistics Occupational Employment and Wage Statistics (OEWS) survey, May 2026 release. The BLS reported a median annual salary of $50,688 for data analystsin the Granger metropolitan area. A 4.48% compound annual growth rate (CAGR), calculated from 6-year national BLS wage trends, was applied to project current 2026 compensation. Percentile ranges (P10–P90) represent the full salary distribution across experience levels and practice settings in this market.
Data Sources & Methodology
Salary data for Granger is estimated from official BLS state-level occupational wage data (2025), adjusted for regional cost-of-living differences using BEA RPP (Regional Price Parities).
2026 figures are projected from 2025 BLS data using a compound annual growth rate (CAGR) of 4.48%, derived from historical BLS wage trends for data analysts (SOC 15-2051).
Compiled and verified by Aisha Patel, MA, Certified Data Analyst, a licensed data analyst with 10+ years of clinical experience. · View source data at BLS.gov