Data Analyst Salary in Northbrook, IL: $66,162 (2026)
Quick Answer:A full-time data analyst in Northbrook, IL earns a median $66,162/year (≈ $31.80/hour) in nominal terms for 2026 — projected from BLS OEWS 2025 (SOC 15-2051). Once you factor in Northbrook's price level (3% below national, BEA RPP 97.1), that paycheck buys what $68,138 would nationally. Nominal pay sits 1.4% below the Illinois state average.
Based on BLS state-level estimates · View source
With a projected 2026 median salary of $66,162, data analysts in Northbrook, Illinois, are earning notably less than their national counterparts, who average $80,394. The salary range for local data analysts stretches from $38,374 at the 10th percentile to $102,551 at the 90th, reflecting a diverse spectrum of compensation based on experience, skill level, and the type of employer. These figures, derived from state-level BLS data and adjusted for regional cost factors, underscore a significant variance in pay that can be influenced by the choice of industry. Northbrook's job market offers opportunities across various sectors, from traditional industries to newer, growing fields, yet those employed by major tech firms or specialized AI startups often see the most competitive compensation packages.
About the Northbrook Market
Salary estimated from Illinois average ($115,000) adjusted for local cost of living.
Salary Breakdown
| Percentile | Annual | Hourly |
|---|---|---|
| Entry Level (P10) | $38,374 | $18.45 |
| Lower Range (P25) | $47,637 | $22.90 |
| Median (P50)(typical) | $66,162 | $31.80 |
| Upper Range (P75) | $84,687 | $40.72 |
| Top Earners (P90) | $102,551 | $49.30 |
Median Salary Position
17.7% below the national average
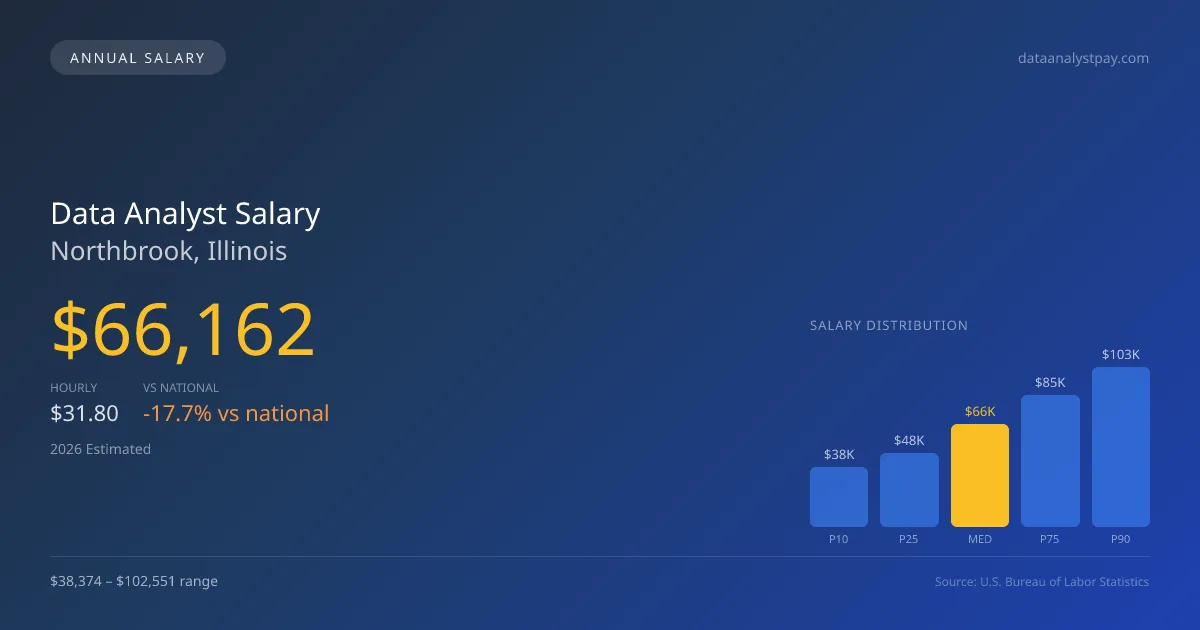
2026 Salary Percentile Distribution in Northbrook
In Northbrook, IL, the data analyst salary spread from the 10th to 90th percentile is $64,177 (2026 est.). At $66,162, the local median is 17.7% below the national median of $80,394.
Salary Calculator
At 40 hours/week in Northbrook: You'd be in the lower-middle range
How Northbrook Data Analyst Pay Compares
Northbrook median: $66,162/year (2026)
| Compared To | Median Salary | Northbrook Pays |
|---|---|---|
| Illinois Average | $67,101 | -1.40% less |
| National Average | $80,394 | -17.70% less |
Data Analysts in Northbrook, IL earn a median of $66,162 per year (2026 est.), which is 17.70% lower than the national median of $80,394 and 1.40% below the Illinois state average of $67,101.
Cost-of-Living Adjusted Salary
Northbrook has a cost of living 2.90% below the national average, meaning your salary goes further here.
Adjusted salary = nominal × (100 / CoL index). CoL index: 100 = national average.
Northbrook, IL has a cost-of-living index of 97.1 (below the national average of 100). A data analyst earning $66,162 nominally has purchasing power equivalent to $68,138 in an average-cost city — an effective 2.99% boost.
Compare Purchasing Power
Select a city to see how your salary compares after cost of living
Select a city above to compare purchasing power
2021 BLS Actual
$53,149
2025 BLS Actual
$63,325
2026 Current Est.
$66,162
2021–2027 Growth
+30.1%
Salary Trajectory for Data Analysts in Northbrook (2021–2027)
2021–2025: actual BLS OEWS data for this metro area. 2026+: CAGR 4.48% projection.
| Year | Annual Salary | Status |
|---|---|---|
| 2021 | $53,149 | Actual |
| 2022 | $54,513 | Actual |
| 2023 | $56,894 | Actual |
| 2024 | $110,139 | Actual |
| 2025 | $63,325 | Actual |
| 2026(current) | $66,162 | Estimated |
| 2027 | $69,126 | Projected |
Based on 5 years of BLS OEWS data for the Northbrook metropolitan area, the median data analyst salary grew 19.1% from $53,149 (2021) to $63,325 (2025). At a 4.48% compound annual growth rate, salaries are projected to reach $69,126 by 2027 — a total increase of $15,977 (30.06%) from 2021.
Note: Historical values (2021–2025) are actual BLS OEWS figures for the Northbrook metropolitan area, sourced from annual Occupational Employment and Wage Statistics surveys. 2026–2026 figures are current estimates, and 2027 values are projections, calculated using a 4.48% CAGR derived from 5-year BLS historical data. Actual salaries may vary based on employer, experience, certifications, and local market conditions.
Salary by Experience Level
| Experience | Estimated Salary Range |
|---|---|
| 0-2 years (New Graduate) | $38,374 – $47,637 |
| 3-5 years (Mid Career) | $47,637 – $66,162 |
| 5+ years (Experienced) | $66,162 – $84,687 |
| 10+ years (Top Earner) | $84,687 – $102,551 |
DA salary ranges estimated from BLS percentile data. Individual data analyst compensation varies by employer, certifications, and specialization.
Data Analyst Job Market in Northbrook
In terms of the local job market, only eight data analysts are currently employed in Northbrook, indicating a niche environment for this profession. With a cost-of-living index of 97.1, analysts may find that their take-home pay doesn't stretch as far as it might in other regions with higher living costs. Employer tiers can create disparities in compensation, with FAANG companies and leading AI firms consistently paying higher salaries due to their emphasis on equity and total compensation packages that include substantial RSUs. Data analysts focusing on machine learning engineering or advanced quantitative methods often command better pay than those in traditional analytics or less specialized roles. For those aiming to maximize their earnings, negotiating offers in line with local realities and leveraging skills in high-demand areas are crucial strategies to achieve higher compensation in Northbrook's evolving job market.
More salary data for Northbrook, IL:
Frequently Asked Questions
How much do data analysts make in Northbrook, IL in 2026?
Is Northbrook, IL a good place to work as a data analyst?
Can data analysts make $100K in Northbrook?
What is the cost-of-living adjusted data analyst salary in Northbrook?
How much does a data analyst make per hour in Northbrook?
Related Pages
Compare Salaries
Career Resources
Nearby Cities in Illinois
Written by Aisha Patel, MA, Certified Data Analyst
Career Analyst
Aisha has 10 years of experience in data analysis. She specializes in business intelligence and works at a tech consulting firm.
Methodology & Data Source
Salary figures on this page are 2026 projections based on the Bureau of Labor Statistics Occupational Employment and Wage Statistics (OEWS) survey, May 2026 release. The BLS reported a median annual salary of $63,325 for data analystsin the Northbrook metropolitan area. A 4.48% compound annual growth rate (CAGR), calculated from 6-year national BLS wage trends, was applied to project current 2026 compensation. Percentile ranges (P10–P90) represent the full salary distribution across experience levels and practice settings in this market.
Data Sources & Methodology
Salary data for Northbrook is estimated from official BLS state-level occupational wage data (2025), adjusted for regional cost-of-living differences using BEA RPP (Regional Price Parities).
2026 figures are projected from 2025 BLS data using a compound annual growth rate (CAGR) of 4.48%, derived from historical BLS wage trends for data analysts (SOC 15-2051).
Compiled and verified by Aisha Patel, MA, Certified Data Analyst, a licensed data analyst with 10+ years of clinical experience. · View source data at BLS.gov