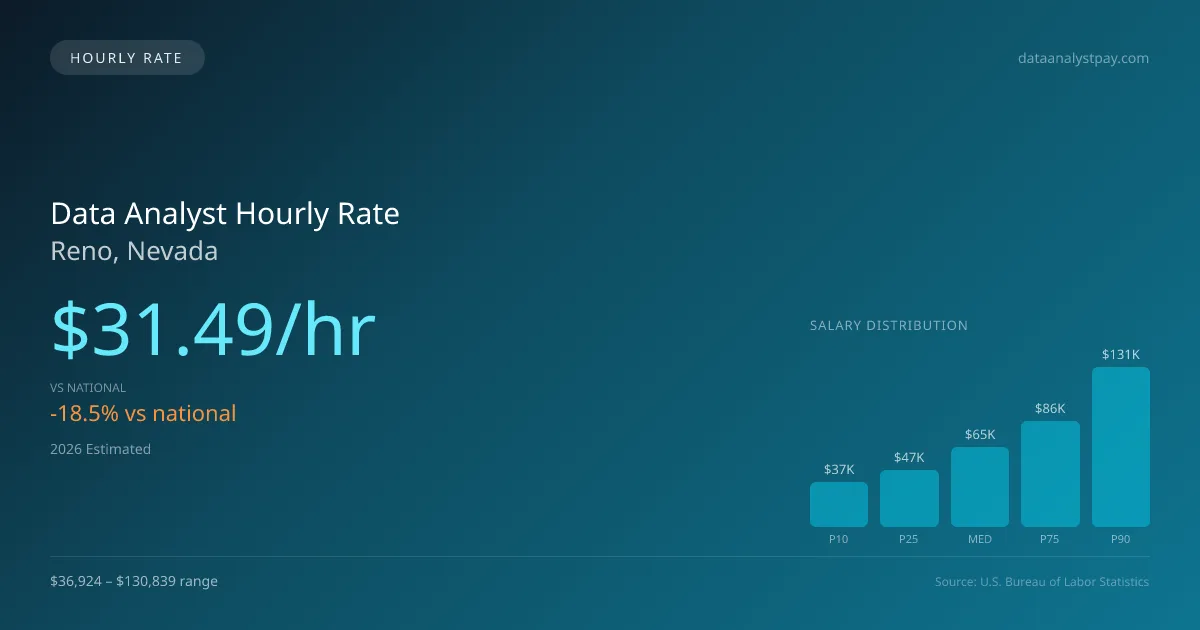
Data Analyst Hourly Pay in Reno, NV: $31.49 (2026)
Quick Answer:Hourly pay for a data analyst working in Reno, NV runs $31.49 at the median for 2026 — annualizing to $65,490 at a standard 2,080-hour year. Figures projected from BLS OEWS 2025 (SOC 15-2051). Weighted against Reno's regional price level (BEA RPP 101.0, 1% above national), each hour of work buys what $31.17 nationally would. A 24-hour part-time schedule grosses $39,300 per year.
Official BLS data · View source
In Reno, Nevada, the data analyst hourly pay stands at a median of $31.49, which is significantly lower than the national hourly median of $38.65. This discrepancy can influence the dynamics for part-time and per-diem workers who often find themselves in environments like technology workplaces and hybrid settings, where they may work three days a week. The hourly compensation in Reno ranges from $17.75 at the entry-level to an impressive $62.90 for top earners. This data is sourced from the Bureau of Labor Statistics and indicates a professional landscape where earning potential can vary considerably based on experience and the type of organization one joins, whether that be a local tech company or a larger national firm.
Data Analyst Hourly Wage Breakdown
| Percentile | Hourly Rate | Per 8hr Shift |
|---|---|---|
| Entry Level (P10) | $17.75 | $142.01 |
| Lower Range (P25) | $22.40 | $179.20 |
| Median (P50) | $31.49 | $251.92 |
| Upper Range (P75) | $41.54 | $332.33 |
| Top Earners (P90) | $62.90 | $503.18 |
Estimated Annual Income by Work Schedule in Reno
Based on $31.49/hr median hourly rate · 2026 est.
At $31.49/hr, a data analyst working full-time (40 hr/wk) in Reno, NV can expect to earn approximately $65,500 per year (2026 est.). Part-time hygienists working 24 hours per week would earn around $37,788. With a cost-of-living index of 101.01 (above the national average), these earnings may be offset by higher expenses in Reno.
Hourly Rate Calculator
Schedule Comparison in Reno
| Schedule | Weekly | Monthly | Annual |
|---|---|---|---|
| Full-Time (40 hrs) | $1,259.61 | $5,458 | $65,500 |
| Part-Time (24 hrs) | $755.77 | $3,275 | $39,300 |
| Per Diem (16 hrs) | $503.84 | $2,183 | $26,200 |
Compare DA Wages With Similar Roles
| Role | Median Hourly |
|---|---|
| Data Analyst (Reno) | $31.49 |
| Data Analyst (National Avg) | $40.39 |
| Software Developer (National Avg) | $64.54 |
| Machine Learning Engineer (National Avg) | $66.77 |
| Statistician (National Avg) | $50.61 |
Data Analysts in Reno, NV earn a median of $65,490 per year (2026 est.), which is 18.54% lower than the national median of $80,394 and 29.50% above the Nevada state average of $50,572.
Data Analyst Hourly Pay vs. Cost of Living
Working 24h/week at $31.49/hr = $39,300/year (purchasing power: $38,905).
Working 40h/week (full-time) = $65,500/year (purchasing power: $64,842).
CoL index: 101.014 (100 = national average).
2021 BLS Actual
$38.39/hr
2025 BLS Actual
$30.14/hr
2026 Current Est.
$31.49/hr
2021–2027 Growth
+-14.3%
Hourly Rate Trajectory for Data Analysts in Reno (2021–2027)
2021–2025: actual BLS OEWS data for this metro area. 2026+: CAGR 4.48% projection.
| Year | Hourly Rate | Status |
|---|---|---|
| 2021 | $38.39/hr | Actual |
| 2022 | $41.16/hr | Actual |
| 2023 | $39.75/hr | Actual |
| 2024 | $44.13/hr | Actual |
| 2025 | $30.14/hr | Actual |
| 2026(current) | $31.49/hr | Estimated |
| 2027 | $32.90/hr | Projected |
Based on 5 years of BLS OEWS metropolitan area data, the median hourly rate for data analysts in Reno grew -21.5% from $38.39/hr (2021) to $30.14/hr (2025). At a 4.48% projected growth rate, hourly pay is expected to reach $32.90/hr by 2027. Part-time and per-diem data analysts can use this multi-year trend to benchmark future contract negotiations.
Note: Historical values (2021–2025) are actual BLS OEWS figures for the Reno metropolitan area, sourced from annual Occupational Employment and Wage Statistics surveys. 2026–2026 figures are current estimates, and 2027 values are projections, calculated using a 4.48% CAGR derived from 5-year BLS historical data. Actual salaries may vary based on employer, experience, certifications, and local market conditions.
Working as an Hourly Data Analyst in Reno
Looking at the earning potential for part-time data analysts in Reno, those working three days a week for a total of 24 hours annually would take home around $39,600, which falls short compared to full-time equivalents due to the reduced hours. Per-diem data analyst pay in Reno tends to be quite volatile; it can range from $100 to $200 per hour for contract work, and seasoned machine learning engineering consultants can command $200 to $400 per hour. Companies across various sectors, including FAANG, AI startups, and financial quant firms, reflect diverse pay structures, with some employers offering lower hourly rates in exchange for benefits like health insurance. When negotiating hourly pay, local analysts may find success by highlighting their technical skills and project experience, especially in an evolving field that demands expertise in areas like Python and machine learning frameworks.
More salary data for Reno, NV:
Frequently Asked Questions
What is the hourly rate for data analysts in Reno in 2026?
How much do part-time data analysts make in Reno?
Are data analysts in Reno paid hourly or salary?
How much does a full-time data analyst make per year in Reno?
Do data analysts earn more per hour working part-time in Reno?
Related Pages
Compare Salaries
Career Resources
Nearby Cities in Nevada
Written by Aisha Patel, MA, Certified Data Analyst
Career Analyst
Aisha has 10 years of experience in data analysis. She specializes in business intelligence and works at a tech consulting firm.
Methodology & Data Source
Hourly wage figures on this page are 2026 projections based on the Bureau of Labor Statistics Occupational Employment and Wage Statistics (OEWS) survey, May 2026 release. A 4.48% compound annual growth rate (CAGR), derived from 6-year national BLS wage trends, was applied to estimate current 2026 hourly rates for data analysts in Reno. Part-time and full-time income estimates assume consistent weekly hours and do not account for overtime, benefits, or seasonal variation.
Data Sources & Methodology
Source: BLS, OEWS, 5-year dataset (–). Per-city data from annual BLS metropolitan area surveys.
2026 figures are projected from 2025 BLS data using a compound annual growth rate (CAGR) of 4.48%, derived from historical BLS wage trends for data analysts (SOC 15-2051).
Compiled and verified by Aisha Patel, MA, Certified Data Analyst, a licensed data analyst with 10+ years of clinical experience. · View source data at BLS.gov